Filters: Tags: Freshwater (X)
89 results (276ms)|
Filters
Date Range
Extensions
Types Contacts
Categories Tag Types
|
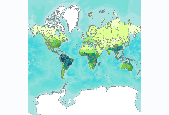
Number of amphibian species, by freshwater ecoregion. We calculated the number of amphibian species per freshwater ecoregion using species range maps of the Global Amphibian Assessment (GAA, www.iucnredlist.org/amphibians) (IUCN et al. 2006). The 2006 GAA assessed 5,918 amphibian species and provided distribution maps for 5,640 of those species. When a range overlapped several ecoregions, we counted species as present in all those ecoregions that had part of the range. This may have resulted in an overestimate of species numbers in some ecoregions, especially those that are long and narrow in shape. This is particularly true for the Amazonas High Andes ecoregion (312), where the mountain range has been used as...

This assessment presents GIS data containing results of all freshwater assessment analyses conducted by The Nature Conservancy for Washington State. This data set includes values for biodiversity metrics (e.g. suitability, threat, number of species) across all HUC6 watersheds in Washington State, as well as identifies rivers, watersheds, and wetlands that provide the best opportunities for conservation of Washington's native freshwater species and ecological systems. Fore more information, visit waconservation.org .
Abstract (from http://onlinelibrary.wiley.com/doi/10.1111/fwb.12290/abstract): Freshwater mussels (Unionidae) are a highly imperilled faunal group. One critical threat is thermal sensitivity, because global climate change and other anthropogenic activities contribute to increasing stream temperature and altered hydrologic flow that may be detrimental to freshwater mussels. We incorporated four benthic environmental components – temperature, sediment, water level (a surrogate for flow) and a vertical thermal gradient in the sediment column – in laboratory mesocosm experiments with juveniles of two species of freshwater mussels (Lampsilis abrupta and Lampsilis radiata) and tested their effects on survival, burrowing...
Categories: Publication;
Types: Citation;
Tags: National CASC,
Other Wildlife,
Wildlife and Plants,
burrowing,
byssus,
This .zip folder contains final ancillary data layers used to create Southeast Conservation Blueprint 2022 that were not included in the main data download package.
Categories: Data;
Types: Map Service,
OGC WFS Layer,
OGC WMS Layer,
OGC WMS Service;
Tags: Coastal and marine,
Cultural,
Data,
Freshwater,
Indicator,
Citation: Master, Lawrence L., Stephanie R. Flack and Bruce A. Stein, eds. 1998. Rivers of Life: Critical Watersheds for Protecting Freshwater Biodiversity . The Nature Conservancy, Arlington, Virginia. From the report summary: Although at-risk freshwater species can be assessed at the level of states or large regional water- sheds, Rivers of Life: Critical Watersheds for Protecting Freshwater Biodiversity presents the first analysis to define conservation priorities on a scale that is practical for action. Approximately 2,100 small watersheds cover the continental United States. These small watershed areas reflect a scale appropriate for planning and carrying out conservation actions. Using information from natural...

Number of freshwater fish species, by freshwater ecoregion. The map of freshwater fish species richness—the number of species present in each ecoregion—was generated from a variety of sources by Abell et al. (2008). Only species using freshwater for at least a portion of their life cycles, as identified using the habitat assignments in FishBase, are included. For the United States, NatureServe provided presence/absence data for individual species, coded to eight-digit hydrologic unit codes (HUCs); these HUC occurrences were then translated into ecoregions, and the data were manually cleaned of erroneous occurrences derived from species introductions and problematic records. For all other ecoregions, species lists...

Number of migratory fish species, by freshwater ecoregion. We derived the map of long-distance migrant (LDM) fish—the number of LDM species per ecoregion—from published literature, online databases (NatureServe), and expert inquiries. Potadromous, anadromous, amphidromous, and catadromous fish species were judged to be LDMs if they made regular journeys (i.e., for breeding, dispersal, feeding) of at least a hundred kilometers or more in freshwater. These species were then assigned to ecoregions based on the fish species lists database from Abell et al. (2008). Although we used many resources, two key data sources for the map were the following: Carolsfeld, J., B. Harvey, C. Ross, and A. Baer, eds. 2003. Migratory...
To inform the design and implementation of land-use policies that consider the variety of goods and services people derive from ecosystems, it is essential to understand spatial patterns of individual services, how multiple services relate to each other, and how these relationships vary across spatial scales and localities. Despite the importance of freshwater as a determinant of regional economic and human demographic patterns, there are surprisingly few studies that map the provision of a range of services associated with the quality of the aquatic environment. Here we examine relationships between indicators of riverine water and associated habitat quality, freshwater biodiversity, three terrestrial ecosystem...
These data are the primary data used to estimate rainbow trout abundance and survival in the Colorado River, Glen and Grand Canyons. Refer to the analyses as per the associated journal manuscript (see Larger Work Citation). Prey availability, feeding efficiency, and competition reduce somatic growth and cause the collapse of a fish population" Nighttime boat electrofishing was used to sample rainbow trout four times per year in April, July, September, and January, from April 2012 through September 2016. A total of five reaches were sampled between Glen Canyon Dam (river kilometer [rkm] 0) to below the confluence with the Little Colorado River (located at rkm 130). Reaches ranged from two to six km in length. A total...
EAU BC is a hierarchical classification of BC's freshwater ecosystems. It is a spatially explicit classification designed to aid in the management and conservation of BC freshwater ecosystems and their associated biodiversity. EAU BC quantifies the interplay between freshwater species distribution and their ecosystem physical habitat, and environmental processes. It defines what is currently known about freshwater ecosystems and their abundance and distribution across the Province. It is packaged as a database and accompanying geographic information system (GIS) that enables the classification and its underlying data to be queried and viewed at multiple spatial scales. Available EAUBC GIS data include EAUBC Freshwater...
Note: This data release has been superseded by version 3.0, available here: http://doi.org/10.5066/P9UGEZPT This U.S. Geological Survey (USGS) data release provides phytoplankton data collected from Cheney Reservoir, Kansas, during June 2001 through October 2016. All data are reported as raw calculated values and are not rounded to USGS significant figures. This data release was produced in compliance with the open data requirements as a way to make scientific products associated with USGS research efforts and publications available to the public. The dataset includes all routine and quality-assurance/quality-control samples collected at the long-term sampling site on Cheney Reservoir near Cheney Dam (USGS station...
Categories: Data,
Data Release - Revised;
Tags: Algae,
Cheney Reservoir,
Division,
Freshwater,
Genus,
This U.S. Geological Survey (USGS) data release provides phytoplankton data collected as part of an advanced harmful algae bloom (HAB) monitoring study conducted in collaboration with the New York State Department of Environmental Conservation (NYSDEC). Samples were collected biweekly in association with continuous monitoring platforms in Owasco, Seneca, and Skaneateles Lakes, Finger Lakes Region, New York and one opportunistic bloom sample site at Emerson Park Boat Launch in Owasco Lake. The platforms were deployed from May-November in 2019 and June-October in 2020. This dataset includes all routine and quality assurance/quality control samples collected at the four sampling locations on the three lakes: three...
The combination of a complex hydrogeologic framework, narrow land masses surrounded by saltwater, and extensive ground-water public-supply pumpage has produced localized areas of elevated chloride concentrations in ground water. This project uses advanced surface and borehole geophysical methods to determine the extent of saltwater intrusion and road-salt plumes at selected sites in eastern Suffolk County, Long Island, NY. Two-dimensional resistivity sections have been integrated with borehole geophysical logs and water-quality data to produce cross-sections of road-salt plumes. Borehole geophysical logs are collected twice a year to determine variations in chloride concentration and thicknesses of intrusive...
Categories: Data,
Project;
Types: Downloadable,
Map Service,
OGC WFS Layer,
OGC WMS Layer,
Shapefile;
Tags: Borehole Geophysics,
Borehole Geophysics,
Borehole Geophysics,
Cooperative Water Program,
GW or SW,
This U.S. Geological Survey (USGS) Data Release provides phytoplankton data for samples collected from twelve large river sites throughout the United States, from June through October 2019. All data are reported as raw calculated values and are not rounded to USGS significant figures. The dataset includes all routine and quality assurance/quality control samples collected as part of a National Water Quality Assessment Project pilot study to describe cyanobacteria and cyanotoxin occurrence in the Nation's large rivers. Phytoplankton were identified to the lowest possible taxonomic level with both abundance (reported as both natural units and cells) and biovolume reported.
Categories: Data;
Types: Map Service,
OGC WFS Layer,
OGC WMS Layer,
OGC WMS Service;
Tags: Algae,
Aquatic Biology,
California,
Chattahoochee River near Whitesburg, GA,
Connecticut,
This indicator combines measures of water quality, sediment quality, contaminants in fish tissue, and benthic community condition to create an overall index of coastal estuarine condition. It originates from the Environmental Protection Agency’s National Coastal Condition Assessment data.Reason for SelectionThis index measures the condition of the nation’s estuaries following standard national methodologies and is synthesized by the U.S. Environmental Protection Agency (EPA) roughly every five years. Estuaries serve as important nursery habitat for wildlife, including many species of fish and shellfish eaten as seafood. They also improve water quality by filtering out sediments and pollutants, provide recreational...
Categories: Data;
Types: Map Service,
OGC WFS Layer,
OGC WMS Layer,
OGC WMS Service;
Tags: Coastal and Marine Indicator,
Coastal and marine,
Cultural,
Data,
Freshwater,
This file contains a generalized representation of watersheds developed from the 1:50,000 BC Watershed Atlas with each region coded for occurrence of freshwater fish species (including anadromous salmon in their freshwater stages). The initial fish species codes for presence/absence in each watershed were dervied from an GIS overlay of fish species occurrences within broadly defined fish regions for BC. This overlay of fish ranges describes the occurrences of fish species in 30 regions throughout the province. These broad species ranges were derived from McPhail and Carveth's 'Key to Freshwater Fish of BC' and refined further based on the most current expert opinion. Coding for watershed polygons based on this expert...
This U.S. Geological Survey (USGS) Data Release provides phytoplankton data collected from Cheney Reservoir, Kansas, during June 2001 through September 2020. All data are reported as raw calculated values and are not rounded to USGS significant figures. This data release was produced in compliance with the open data requirements as a way to make scientific products associated with USGS research efforts and publications available to the public. The dataset includes all routine and quality assurance/quality control samples collected at the long-term sampling site on Cheney Reservoir located near the dam (USGS station identification number 07144790). Phytoplankton were identified to the lowest possible taxonomic level...
Categories: Data,
Data Release - Revised;
Tags: Algae,
Cheney Reservoir,
Division,
Freshwater,
Genus,
Note: This data release has been superseded by version 2.0, available here: https://doi.org/10.5066/P968UDS7. This U.S. Geological Survey (USGS) data release provides zooplankton data collected from Cheney Reservoir, Kansas, during October 2008 through July 2021. All data are reported as raw calculated values and are not rounded to USGS significant figures. This data release was produced in compliance with the open data requirements as a way to make scientific products associated with USGS research efforts and publications available to the public. The dataset includes all routine and quality assurance/quality control samples collected at the long-term sampling site on Cheney Reservoir located near the dam (USGS...
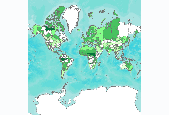
Area of wetlands in each freshwater ecoregion protected under Ramsar Convention. We derived the area of wetlands of international importance protected under the Ramsar Convention in each freshwater ecoregion from a subset of areas included in the World Database on Protected Areas (WDPA) compiled by the UNEP World Conservation Monitoring Centre (UNEP/IUCN 2007). All Ramsar sites in the database were included, except those known to be purely marine in extent, as indicated by the Marine Classes noted as subtidal in the WDPA. Intertidal marine Ramsar sites, however, are included in the analysis because the sites may include both brackish and fresh-waters. Area attributes for those Ramsar sites within the WDPA that...

Number of freshwater bird species, by freshwater ecoregion. Freshwater obligate birds include those species that need freshwater habitats for breeding (e.g., ducks, herons) or feeding (i.e., birds that depend almost exclusively on food found in freshwater habitats, such as freshwater fish, mollusks, and crustaceans). In all, 815 bird species were found to meet this criterion, with almost all bird families represented. We mapped freshwater bird species to freshwater ecoregions with the following procedures: for North and South America, NatureServe GIS data were summarized by freshwater ecoregion; for Africa, distribution maps presented in Birds of Africa (Brown et al. 1982–1997) were used to assign species to freshwater...
|

|
