Filters: Tags: Gadsden County (X)
39 results (87ms)|
Filters
Date Range
Extensions Types Contacts
Categories Tag Types Tag Schemes |
Layers of geospatial data include contours, boundaries, land cover, hydrography, roads, transportation, geographic names, structures, and other selected map features.
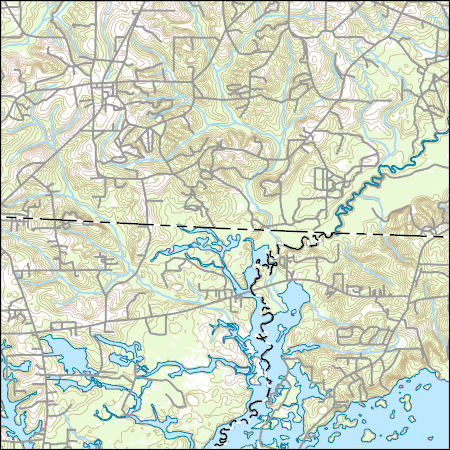
Layered geospatial PDF 7.5 Minute Quadrangle Map. Layers of geospatial data include orthoimagery, roads, grids, geographic names, elevation contours, hydrography, and other selected map features. This map is derived from GIS (geospatial information system) data. It represents a repackaging of GIS data in traditional map form, not creation of new information. The geospatial data in this map are from selected National Map data holdings and other government sources.
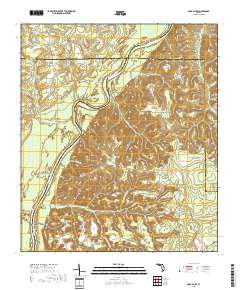
Layered geospatial PDF 7.5 Minute Quadrangle Map. Layers of geospatial data include orthoimagery, roads, grids, geographic names, elevation contours, hydrography, and other selected map features. This map is derived from GIS (geospatial information system) data. It represents a repackaging of GIS data in traditional map form, not creation of new information. The geospatial data in this map are from selected National Map data holdings and other government sources.
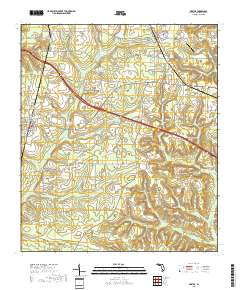
Layered geospatial PDF 7.5 Minute Quadrangle Map. Layers of geospatial data include orthoimagery, roads, grids, geographic names, elevation contours, hydrography, and other selected map features. This map is derived from GIS (geospatial information system) data. It represents a repackaging of GIS data in traditional map form, not creation of new information. The geospatial data in this map are from selected National Map data holdings and other government sources.
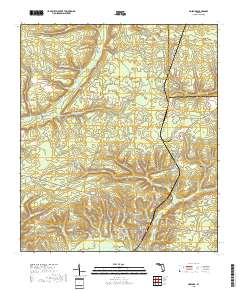
Layered geospatial PDF 7.5 Minute Quadrangle Map. Layers of geospatial data include orthoimagery, roads, grids, geographic names, elevation contours, hydrography, and other selected map features. This map is derived from GIS (geospatial information system) data. It represents a repackaging of GIS data in traditional map form, not creation of new information. The geospatial data in this map are from selected National Map data holdings and other government sources.
A table summarizing the inventoried acreage by crop type and irrigation system was compiled for Gadsden County, Florida. The irrigated acreage totals were derived from analyses of satellite and aerial imagery. Crop types and irrigation system types were verified during field trips that started in May 2021 and concluded in August 2021. In addition, the table provides acreage totals by crop type reported by the U.S. Department of Commerce for 1982, the U.S. Department of Agriculture from 1987 through 2017, and Florida Statewide Agricultural Irrigation Demand for 2018-19.
Categories: Data;
Tags: Crop type,
Florida,
Florida Department of Agriculture and Consumer Services,
Gadsden County,
Groundwater,
Layered geospatial PDF 7.5 Minute Quadrangle Map. Layers of geospatial data include orthoimagery, roads, grids, geographic names, elevation contours, hydrography, and other selected map features. This map is derived from GIS (geospatial information system) data. It represents a repackaging of GIS data in traditional map form, not creation of new information. The geospatial data in this map are from selected National Map data holdings and other government sources.
Layered geospatial PDF 7.5 Minute Quadrangle Map. Layers of geospatial data include orthoimagery, roads, grids, geographic names, elevation contours, hydrography, and other selected map features. This map is derived from GIS (geospatial information system) data. It represents a repackaging of GIS data in traditional map form, not creation of new information. The geospatial data in this map are from selected National Map data holdings and other government sources.
Layered geospatial PDF 7.5 Minute Quadrangle Map. Layers of geospatial data include orthoimagery, roads, grids, geographic names, elevation contours, hydrography, and other selected map features. This map is derived from GIS (geospatial information system) data. It represents a repackaging of GIS data in traditional map form, not creation of new information. The geospatial data in this map are from selected National Map data holdings and other government sources.
Layered geospatial PDF 7.5 Minute Quadrangle Map. Layers of geospatial data include orthoimagery, roads, grids, geographic names, elevation contours, hydrography, and other selected map features. This map is derived from GIS (geospatial information system) data. It represents a repackaging of GIS data in traditional map form, not creation of new information. The geospatial data in this map are from selected National Map data holdings and other government sources.
Layered geospatial PDF 7.5 Minute Quadrangle Map. Layers of geospatial data include orthoimagery, roads, grids, geographic names, elevation contours, hydrography, and other selected map features. This map is derived from GIS (geospatial information system) data. It represents a repackaging of GIS data in traditional map form, not creation of new information. The geospatial data in this map are from selected National Map data holdings and other government sources.
Layered geospatial PDF 7.5 Minute Quadrangle Map. Layers of geospatial data include orthoimagery, roads, grids, geographic names, elevation contours, hydrography, and other selected map features. This map is derived from GIS (geospatial information system) data. It represents a repackaging of GIS data in traditional map form, not creation of new information. The geospatial data in this map are from selected National Map data holdings and other government sources.
Layered geospatial PDF 7.5 Minute Quadrangle Map. Layers of geospatial data include orthoimagery, roads, grids, geographic names, elevation contours, hydrography, and other selected map features. This map is derived from GIS (geospatial information system) data. It represents a repackaging of GIS data in traditional map form, not creation of new information. The geospatial data in this map are from selected National Map data holdings and other government sources.
Surface electrical resistivity tomography (ERT), electromagnetic induction (EMI), and self-potential (SP) data were acquired March 9 - 20, 2018 by the U.S. Geological Survey, in collaboration with the U.S. Army Corps of Engineers, at the Jim Woodruff Lock and Dam near Chattahoochee, Florida. Eleven ERT profiles were acquired along the right (west) abutment, and immediately downstream, of the concrete, fixed-crest spillway located west of the lock to map geologic structure at depths up to 50 meters (m) using the Advanced Geosciences, Inc. SuperSting R8 resistivity meter. This data release includes the raw and processed resistivity data as well as inverted resistivity models. All are provided as digital data, and...
Categories: Data;
Types: Downloadable,
Map Service,
OGC WFS Layer,
OGC WMS Layer,
Shapefile;
Tags: Apalachicola River,
Chattahoochee,
Chattahoochee River,
Decatur County,
ERT surveying,
A Geographic Information System (GIS) shapefile and summary tables of irrigated agricultural land-use are provided for the 15 counties fully within the Northwest Florida Water Management District (Bay, Calhoun, Escambia, Franklin, Gadsden, Gulf, Holmes, Jackson, Leon, Liberty, Okaloosa, Santa Rosa, Wakulla, Walton, and Washington counties). These files were compiled through a cooperative project between the U.S. Geological Survey and the Florida Department of Agriculture and Consumer Services, Office of Agricultural Water Policy. Information provided in the shapefile includes the location of irrigated lands that were verified during field surveying that started in May 2021 and concluded in August 2021. Field data...
Layered geospatial PDF 7.5 Minute Quadrangle Map. Layers of geospatial data include orthoimagery, roads, grids, geographic names, elevation contours, hydrography, and other selected map features. This map is derived from GIS (geospatial information system) data. It represents a repackaging of GIS data in traditional map form, not creation of new information. The geospatial data in this map are from selected National Map data holdings and other government sources.
Layered geospatial PDF 7.5 Minute Quadrangle Map. Layers of geospatial data include orthoimagery, roads, grids, geographic names, elevation contours, hydrography, and other selected map features. This map is derived from GIS (geospatial information system) data. It represents a repackaging of GIS data in traditional map form, not creation of new information. The geospatial data in this map are from selected National Map data holdings and other government sources.
Layered geospatial PDF 7.5 Minute Quadrangle Map. Layers of geospatial data include orthoimagery, roads, grids, geographic names, elevation contours, hydrography, and other selected map features. This map is derived from GIS (geospatial information system) data. It represents a repackaging of GIS data in traditional map form, not creation of new information. The geospatial data in this map are from selected National Map data holdings and other government sources.
Layered geospatial PDF 7.5 Minute Quadrangle Map. Layers of geospatial data include orthoimagery, roads, grids, geographic names, elevation contours, hydrography, and other selected map features. This map is derived from GIS (geospatial information system) data. It represents a repackaging of GIS data in traditional map form, not creation of new information. The geospatial data in this map are from selected National Map data holdings and other government sources.
Surface electrical resistivity tomography (ERT), electromagnetic induction (EMI), and self-potential (SP) data were acquired March 9 - 20, 2018 by the U.S. Geological Survey, in collaboration with the U.S. Army Corps of Engineers, at the Jim Woodruff Lock and Dam near Chattahoochee, Florida. Self-potential (SP) data were acquired at 384 unique stations with Borin Stelth 3 copper-copper sulfate porous-pot electrodes and Keysight U1253B high-impedance multimeter to identify variations in subsurface hydrologic flow. This data release includes the raw and processed self-potential data. They are provided as digital data, and data fields are defined in the data dictionary. Jim Woodruff Lock and Dam is located...
Categories: Data;
Types: Downloadable,
Map Service,
OGC WFS Layer,
OGC WMS Layer,
Shapefile;
Tags: Apalachicola River,
Chattahoochee,
Chattahoochee River,
Decatur County,
ERT surveying,
|

|
