Filters: Tags: Grand Isle (X)
123 results (14ms)|
Filters
Date Range
Extensions Types Contacts
Categories Tag Types Tag Schemes |
This data set contains imagery from the National Agriculture Imagery Program (NAIP). The NAIP program is administered by USDA FSA and has been established to support two main FSA strategic goals centered on agricultural production. These are increase stewardship of America's natural resources while enhancing the environment, and to ensure commodities are procured and distributed effectively and efficiently to increase food security. The NAIP program supports these goals by acquiring and providing ortho imagery that has been collected during the agricultural growing season in the U.S. The NAIP ortho imagery is tailored to meet FSA requirements and is a fundamental tool used to support FSA farm and conservation programs....
Sandy ocean beaches in the United States are popular tourist and recreational destinations and constitute some of the most valuable real estate in the country. The boundary between land and water along the coastline is often the location of concentrated residential and commercial development and is frequently exposed to a range of natural hazards, which include flooding, storm effects, and coastal erosion. In response, the U.S. Geological Survey (USGS) is conducting a national assessment of coastal change hazards. One component of this research effort, the National Assessment of Shoreline Change Project, documents changes in shoreline position as a proxy for coastal change. Shoreline position is an easily understood...
Categories: Data;
Types: Citation,
Downloadable,
Map Service,
OGC WFS Layer,
OGC WMS Layer,
Shapefile;
Tags: Accretion,
Breton Islands,
Breton National Wildlife Refuge,
CMGP,
Chandeleur Islands,
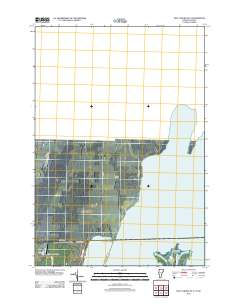
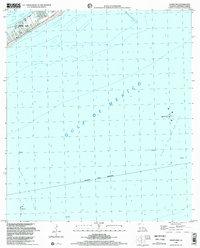
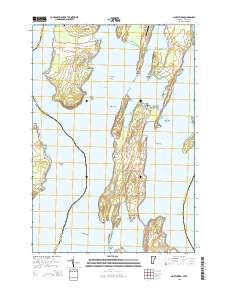
Layered GeoPDF 7.5 Minute Quadrangle Map. Layers of geospatial data include orthoimagery, roads, grids, geographic names, elevation contours, hydrography, and other selected map features.
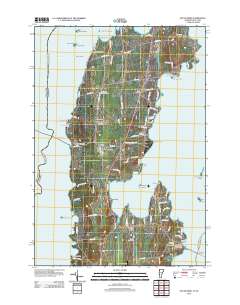
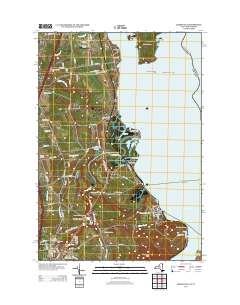
Layered GeoPDF 7.5 Minute Quadrangle Map. Layers of geospatial data include orthoimagery, roads, grids, geographic names, elevation contours, hydrography, and other selected map features.
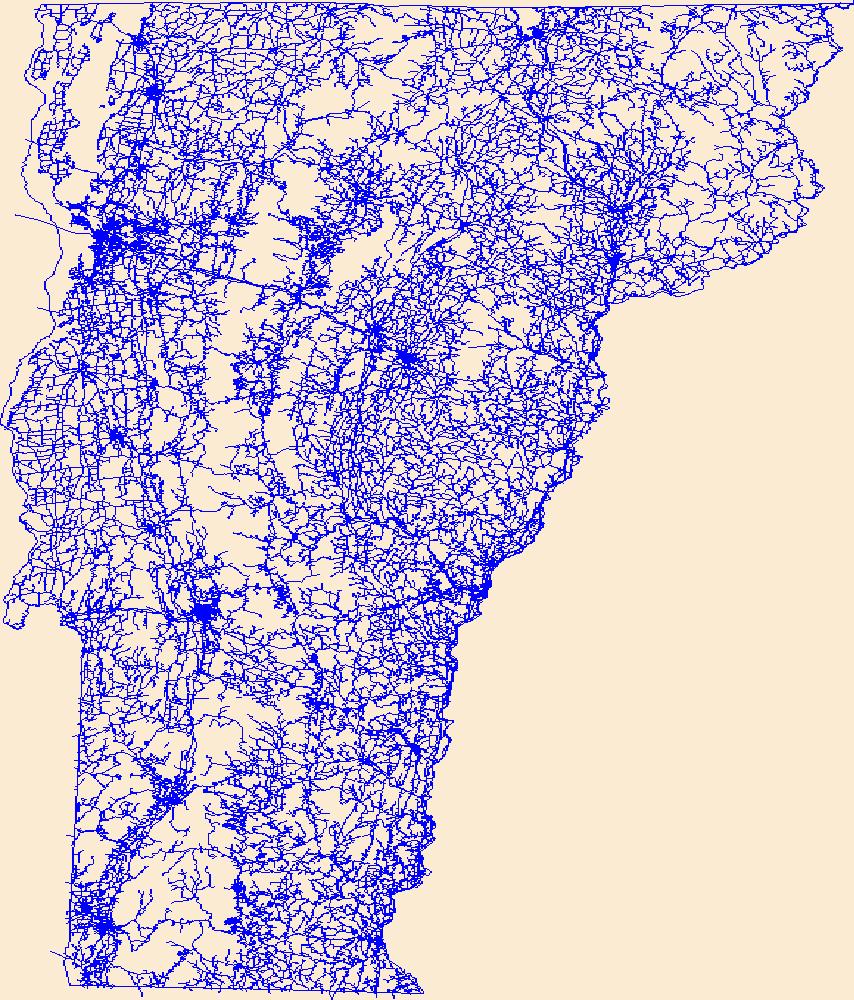
Layers of geospatial data include roads, airports, trails, and railroads.

Layers of geospatial data include roads, airports, trails, and railroads.
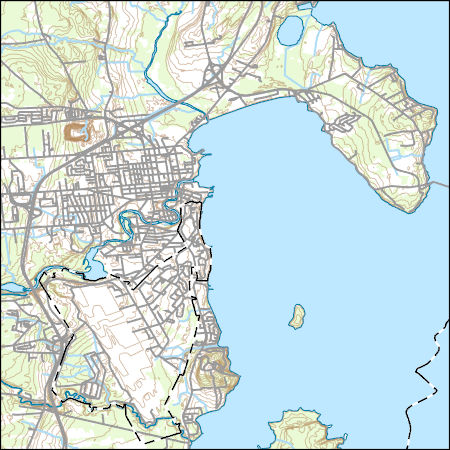
Layers of geospatial data include contours, boundaries, land cover, hydrography, roads, transportation, geographic names, structures, and other selected map features.

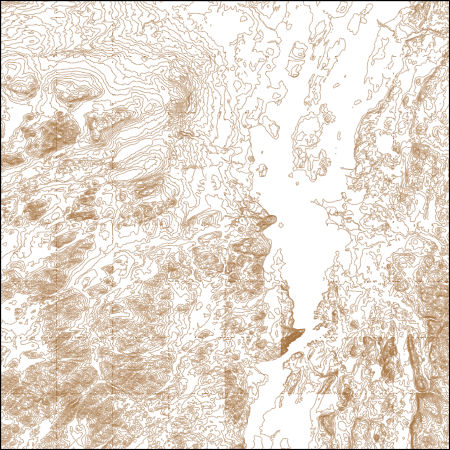
USGS NED 1/3 arc-second Contours for Montreal W, Quebec 1 x 1 degree (published 20240112) GeoPackage
These vector contour lines are derived from the 3D Elevation Program using automated and semi-automated processes. They were created to support 1:24,000-scale CONUS and Hawaii, 1:25,000-scale Alaska, and 1:20,000-scale Puerto Rico / US Virgin Island topographic map products, but are also published in this GIS vector format. Contour intervals are assigned by 7.5-minute quadrangle, so this vector dataset is not visually seamless across quadrangle boundaries. The vector lines have elevation attributes (in feet above mean sea level on NAVD88), but this dataset does not carry line symbols or annotation.
These vector contour lines are derived from the 3D Elevation Program using automated and semi-automated processes. They were created to support 1:24,000-scale CONUS and Hawaii, 1:25,000-scale Alaska, and 1:20,000-scale Puerto Rico / US Virgin Island topographic map products, but are also published in this GIS vector format. Contour intervals are assigned by 7.5-minute quadrangle, so this vector dataset is not visually seamless across quadrangle boundaries. The vector lines have elevation attributes (in feet above mean sea level on NAVD88), but this dataset does not carry line symbols or annotation.
USGS Historical Quadrangle in GeoPDF.
Sandy ocean beaches in the United States are popular tourist and recreational destinations and constitute some of the most valuable real estate in the country. The boundary between land and water along the coastline is often the location of concentrated residential and commercial development and is frequently exposed to a range of natural hazards, which include flooding, storm effects, and coastal erosion. In response, the U.S. Geological Survey (USGS) is conducting a national assessment of coastal change hazards. One component of this research effort, the National Assessment of Shoreline Change Project, documents changes in shoreline position as a proxy for coastal change. Shoreline position is an easily understood...
Types: Citation;
Tags: Breton Islands,
Breton National Wildlife Refuge,
CMGP,
CSC,
Chandeleur Islands,
This data set contains imagery from the National Agriculture Imagery Program (NAIP). The NAIP program is administered by USDA FSA and has been established to support two main FSA strategic goals centered on agricultural production. These are increase stewardship of America's natural resources while enhancing the environment, and to ensure commodities are procured and distributed effectively and efficiently to increase food security. The NAIP program supports these goals by acquiring and providing ortho imagery that has been collected during the agricultural growing season in the U.S. The NAIP ortho imagery is tailored to meet FSA requirements and is a fundamental tool used to support FSA farm and conservation programs....
This data set contains imagery from the National Agriculture Imagery Program (NAIP). The NAIP program is administered by USDA FSA and has been established to support two main FSA strategic goals centered on agricultural production. These are increase stewardship of America's natural resources while enhancing the environment, and to ensure commodities are procured and distributed effectively and efficiently to increase food security. The NAIP program supports these goals by acquiring and providing ortho imagery that has been collected during the agricultural growing season in the U.S. The NAIP ortho imagery is tailored to meet FSA requirements and is a fundamental tool used to support FSA farm and conservation programs....
Layered GeoPDF 7.5 Minute Quadrangle Map. Layers of geospatial data include orthoimagery, roads, grids, geographic names, elevation contours, hydrography, and other selected map features.
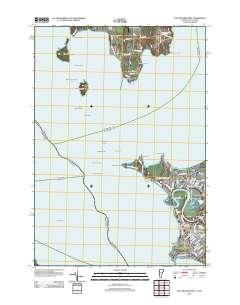
Layered GeoPDF 7.5 Minute Quadrangle Map. Layers of geospatial data include orthoimagery, roads, grids, geographic names, elevation contours, hydrography, and other selected map features.
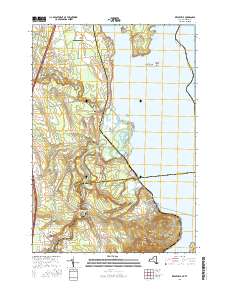
Layered GeoPDF 7.5 Minute Quadrangle Map. Layers of geospatial data include orthoimagery, roads, grids, geographic names, elevation contours, hydrography, and other selected map features.
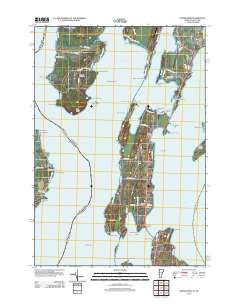
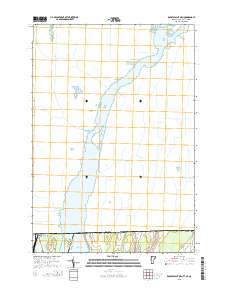
Layered GeoPDF 7.5 Minute Quadrangle Map. Layers of geospatial data include orthoimagery, roads, grids, geographic names, elevation contours, hydrography, and other selected map features.
Layered geospatial PDF Map. Layers of geospatial data include orthoimagery, roads, grids, geographic names, elevation contours, hydrography, and other selected map features.
Layered GeoPDF 7.5 Minute Quadrangle Map. Layers of geospatial data include orthoimagery, roads, grids, geographic names, elevation contours, hydrography, and other selected map features.
|

|
