Filters: Tags: Grand Teton (X)
21 results (79ms)|
Filters
Date Range
Extensions Types Contacts
Categories Tag Types Tag Schemes |
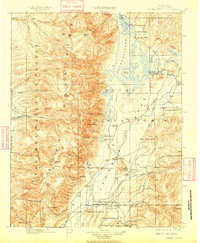
USGS Historical Quadrangle in GeoPDF.
This data set contains imagery from the National Agriculture Imagery Program (NAIP). The NAIP program is administered by USDA FSA and has been established to support two main FSA strategic goals centered on agricultural production. These are, increase stewardship of America's natural resources while enhancing the environment, and to ensure commodities are procured and distributed effectively and efficiently to increase food security. The NAIP program supports these goals by acquiring and providing ortho imagery that has been collected during the agricultural growing season in the U.S. The NAIP ortho imagery is tailored to meet FSA requirements and is a fundamental tool used to support FSA farm and conservation programs....
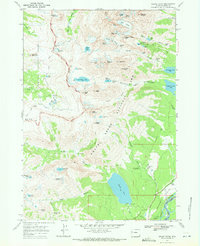
USGS Historical Quadrangle in GeoPDF.
A layer of the National Park Service Boundaries within the state of Wyoming
Categories: Data;
Types: Downloadable;
Tags: Devils Tower,
Grand Teton,
National Parks,
Tourism,
Wyoming,
The grizzly bear distribution boundary represents the estimated geographic extent of occupied range of the Yellowstone grizzly bear population for the period 2004-2018. The distribution boundary was delineated to provide reliable estimations of grizzly bear occupancy throughout time and for use as a monitoring tool in grizzly bear management and conservation. The boundary was delineated by the Interagency Grizzly Bear Study Team (IGBST) using an interpolation method based on grizzly bear telemetry and GPS locations as well as verified observations and signs of grizzly bears inside the Greater Yellowstone Ecosystem during 2004 to 2018.
Categories: Data;
Types: Downloadable,
Map Service,
OGC WFS Layer,
OGC WMS Layer,
Shapefile;
Tags: Beaverhead-Deerlodge,
Bridger-Teton,
Caribou-Targhee,
Custer-Gallatin,
Grand Teton,
The grizzly bear distribution boundary represents the estimated geographic extent of occupied range of the Yellowstone grizzly bear population for the period 1980-1989. The distribution boundary was delineated to provide reliable estimations of grizzly bear occupancy throughout time and for use as a monitoring tool in grizzly bear management and conservation. The boundary was delineated by the Interagency Grizzly Bear Study Team (IGBST) using an interpolation method based on grizzly bear telemetry and GPS locations as well as verified observations and signs of grizzly bears inside the Greater Yellowstone ecosystem during 1980 to1989.
Categories: Data;
Types: Citation,
Downloadable,
Map Service,
OGC WFS Layer,
OGC WMS Layer,
Shapefile;
Tags: Beaverhead-Deerlodge,
Bridger-Teton,
Caribou-Targhee,
Gallatin-Custer,
Grand Teton,
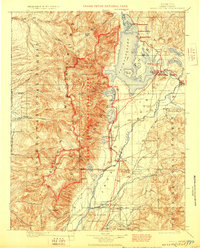
USGS Historical Quadrangle in GeoPDF.
The grizzly bear distribution boundary represents the estimated geographic extent of occupied range of the Yellowstone grizzly bear population for the period 2008-2022. The distribution boundary was delineated to provide reliable estimations of grizzly bear occupancy throughout time and for use as a monitoring tool in grizzly bear management and conservation.The boundary was delineated by the Interagency Grizzly Bear Study Team (IGBST) using an interpolation method based on grizzly bear VHF telemetry and GPS locations as well as verified observations and signs of grizzly bears inside the Greater Yellowstone Ecosystem during 2008 to 2022.
Categories: Data;
Types: Downloadable,
Map Service,
OGC WFS Layer,
OGC WMS Layer,
Shapefile;
Tags: Beaverhead-Deerlodge,
Bridger-Teton,
Caribou-Targhee,
Custer-Gallatin,
Ecology,
This data set contains imagery from the National Agriculture Imagery Program (NAIP). The NAIP program is administered by USDA FSA and has been established to support two main FSA strategic goals centered on agricultural production. These are, increase stewardship of America's natural resources while enhancing the environment, and to ensure commodities are procured and distributed effectively and efficiently to increase food security. The NAIP program supports these goals by acquiring and providing ortho imagery that has been collected during the agricultural growing season in the U.S. The NAIP ortho imagery is tailored to meet FSA requirements and is a fundamental tool used to support FSA farm and conservation programs....
The grizzly bear distribution boundary represents the estimated geographic extent of occupied range of the Yellowstone grizzly bear population for the period 2006-2020. The distribution boundary was delineated to provide reliable estimations of grizzly bear occupancy throughout time and for use as a monitoring tool in grizzly bear management and conservation.The boundary was delineated by the Interagency Grizzly Bear Study Team (IGBST) using an interpolation method based on grizzly bear VHF telemetry and GPS locations as well as verified observations and signs of grizzly bears inside the Greater Yellowstone Ecosystem during 2006 to 2020.
Categories: Data;
Types: Downloadable,
Map Service,
OGC WFS Layer,
OGC WMS Layer,
Shapefile;
Tags: Beaverhead-Deerlodge,
Bridger-Teton,
Caribou-Targhee,
Custer-Gallatin,
Ecology,
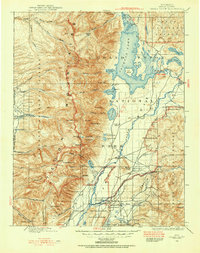
USGS Historical Quadrangle in GeoPDF.
USGS Historical Quadrangle in GeoPDF.
This data set contains imagery from the National Agriculture Imagery Program (NAIP). The NAIP program is administered by USDA FSA and has been established to support two main FSA strategic goals centered on agricultural production. These are, increase stewardship of America's natural resources while enhancing the environment, and to ensure commodities are procured and distributed effectively and efficiently to increase food security. The NAIP program supports these goals by acquiring and providing ortho imagery that has been collected during the agricultural growing season in the U.S. The NAIP ortho imagery is tailored to meet FSA requirements and is a fundamental tool used to support FSA farm and conservation programs....
The grizzly bear distribution boundary represents the estimated geographic extent of occupied range of the Yellowstone grizzly bear population for the period 2000-2014. The distribution boundary was delineated to provide reliable estimations of grizzly bear occupancy throughout time and for use as a monitoring tool in grizzly bear management and conservation. The boundary was delineated by the Interagency Grizzly Bear Study Team (IGBST) using an interpolation method based on grizzly bear telemetry and GPS locations as well as verified observations and signs of grizzly bears inside the Greater Yellowstone ecosystem during 2000 to 2014.
Categories: Data;
Types: Citation,
Downloadable,
Map Service,
OGC WFS Layer,
OGC WMS Layer,
Shapefile;
Tags: Beaverhead-Deerlodge,
Bridger-Teton,
Caribou-Targhee,
Gallatin-Custer,
Grand Teton,
The grizzly bear distribution boundary represents the estimated geographic extent of occupied range of the Yellowstone grizzly bear population for the period 2002-2016. The distribution boundary was delineated to provide reliable estimations of grizzly bear occupancy throughout time and for use as a monitoring tool in grizzly bear management and conservation. The boundary was delineated by the Interagency Grizzly Bear Study Team (IGBST) using an interpolation method based on grizzly bear telemetry and GPS locations as well as verified observations and signs of grizzly bears inside the Greater Yellowstone ecosystem during 2002 to 2016.
Categories: Data;
Types: Citation,
Downloadable,
Map Service,
OGC WFS Layer,
OGC WMS Layer,
Shapefile;
Tags: Beaverhead-Deerlodge,
Bridger-Teton,
Caribou-Targhee,
Custer-Gallatin,
Grand Teton,
USGS Historical Quadrangle in GeoPDF.
This data set contains imagery from the National Agriculture Imagery Program (NAIP). The NAIP program is administered by USDA FSA and has been established to support two main FSA strategic goals centered on agricultural production. These are, increase stewardship of America's natural resources while enhancing the environment, and to ensure commodities are procured and distributed effectively and efficiently to increase food security. The NAIP program supports these goals by acquiring and providing ortho imagery that has been collected during the agricultural growing season in the U.S. The NAIP ortho imagery is tailored to meet FSA requirements and is a fundamental tool used to support FSA farm and conservation programs....
The grizzly bear distribution boundary represents the estimated geographic extent of occupied range of the Yellowstone grizzly bear population for the period 1990-2000. The distribution boundary was delineated to provide reliable estimations of grizzly bear occupancy throughout time and for use as a monitoring tool in grizzly bear management and conservation. The boundary was delineated by the Interagency Grizzly Bear Study Team (IGBST) using an interpolation method based on grizzly bear telemetry and GPS locations as well as verified observations and signs of grizzly bears inside the Greater Yellowstone ecosystem during 1990 to 2000.
Categories: Data;
Types: Citation,
Downloadable,
Map Service,
OGC WFS Layer,
OGC WMS Layer,
Shapefile;
Tags: Beaverhead-Deerlodge,
Bridger-Teton,
Caribou-Targhee,
Gallatin-Custer,
Grand Teton,
The grizzly bear distribution boundary represents the estimated geographic extent of occupied range of the Yellowstone grizzly bear population for the period 1973-1979. The distribution boundary was delineated to provide reliable estimations of grizzly bear occupancy throughout time and for use as a monitoring tool in grizzly bear management and conservation. The boundary was delineated by the Interagency Grizzly Bear Study Team (IGBST) using an interpolation method based on grizzly bear telemetry and GPS locations as well as verified observations and signs of grizzly bears inside the Greater Yellowstone ecosystem during 1973 to1979.
Categories: Data;
Types: Citation,
Downloadable,
Map Service,
OGC WFS Layer,
OGC WMS Layer,
Shapefile;
Tags: Beaverhead-Deerlodge,
Bridger-Teton,
Caribou-Targhee,
Gallatin-Custer,
Grand Teton,
USGS Historical Quadrangle in GeoPDF.
|

|
