Filters: Tags: Ground-water (X)
19 results (27ms)|
Filters
Date Range
Extensions Types Contacts
Categories Tag Types Tag Schemes |

These data were released prior to the October 1, 2016 effective date for the USGS’s policy dictating the review, approval, and release of scientific data as referenced in USGS Survey Manual Chapter 502.8 Fundamental Science Practices: Review and Approval of Scientific Data for Release. MDNET is a point coverage that represents the locations and names of a network of observation wells for the State of Maryland. Additional information on water conditions at these sites can be found in the Ground-Water Site Inventory System (GWSI) database, which is maintained by the U.S. Geological Survey. Site information can be accessed on the internet at URL:
The Cape Fear and Pee Dee River Basins in North Carolina and South Carolina were chosen as a focus area study (FAS) for the U.S. Geological Survey (USGS) National Water Census (NWC) in 2016. The objective of the NWC is to place technical information and tools in the hands of stake holders so that they can make decisions on water availability. The USGS South Atlantic Water Science Center, comprised of North Carolina, South Carolina, and Georgia, conducted a 3-year study of water use and availability to provide information related to the competing societal and ecological water needs in the Southeastern Atlantic Coastal Basins of the Carolinas. The Coastal Carolinas study area includes the Pee Dee and Cape Fear River...

These data were released prior to the October 1, 2016 effective date for the USGS’s policy dictating the review, approval, and release of scientific data as referenced in USGS Survey Manual Chapter 502.8 Fundamental Science Practices: Review and Approval of Scientific Data for Release. The Mojave River and Morongo ground-water basins are in the southwestern part of the Mojave Desert in southern California. Ground-water from these basins supplies a major part of the water requirements for the region. The continuous population growth in this area has resulted in ever-increasing demands on local ground-water resources. The collection and interpretation of ground-water data helps local water districts, military bases,...
Water-level measurements of wells were taken in the Upper Floridan aquifer between the dates of May 2 and June 23, 2010. A GIS shapefile of these water-level measurements was constructed and released as part of a prior USGS publication (Kinnaman and Dixon, 2011). This ArcGIS layer was updated in August 2014 to include salinity-based density corrections to water levels in those areas of south Florida where water in the subject aquifer is not fresh. The density corrections to water levels result in the portrayal of the “equivalent freshwater head” values in brackish and saline areas of the Upper Floridan aquifer where water quality data were available.
Categories: Data;
Types: Downloadable,
Map Service,
OGC WFS Layer,
OGC WMS Layer,
Shapefile;
Tags: Alabama,
Florida,
Floridan aquifer,
Georgia,
Ground-water,
A new method for frequency analysis of hydrologic time series was developed to facilitate the estimation and reconstruction of individual or groups of frequencies from hydrologic time-series and facilitate the comparison of these isolated time-series components across data types, between different hydrologic settings within a watershed, between watersheds, and across frequencies. While climate-related variations in inflow to and outflow from aquifers have often been neglected, the development and management of ground-water and surface-water resources has required the inclusion of the assessment of the effects of climatic variability on the supply and demand and sustainability of use. The regional assessment of climatic...
Categories: Publication;
Types: Citation;
Tags: Climate,
Ground-water,
Rech,
climate cycles,
discharge

These data were released prior to the October 1, 2016 effective date for the USGS’s policy dictating the review, approval, and release of scientific data as referenced in USGS Survey Manual Chapter 502.8 Fundamental Science Practices: Review and Approval of Scientific Data for Release. During 2010, the U.S. Geological Survey and other agencies made approximately 2,500 water-level measurements in the Mojave River and Morongo groundwater basins. These data document recent conditions and, when compared with previous data, changes in groundwater levels. A water-level contour map was drawn using data from about 610 wells, providing coverage for most of the basins. Twenty-eight hydrographs show long-term (up to 70 years)...

These data were released prior to the October 1, 2016 effective date for the USGS’s policy dictating the review, approval, and release of scientific data as referenced in USGS Survey Manual Chapter 502.8 Fundamental Science Practices: Review and Approval of Scientific Data for Release. The USGS compiles online access to water-resources data collected at approximately 1.5 million sites in all 50 States, the District of Columbia, Puerto Rico, the Virgin Islands, Guam, American Samoa and the Commonwealth of the Northern Mariana Islands.

These data were released prior to the October 1, 2016 effective date for the USGS’s policy dictating the review, approval, and release of scientific data as referenced in USGS Survey Manual Chapter 502.8 Fundamental Science Practices: Review and Approval of Scientific Data for Release. This digital geospatial dataset documents the fault traces in the Anza and Terwilliger area of southwest Riverside County, California, that were modified from Moyle (1971) by Woolfenden and Bright (1988, figure 8). The fault information is used to help assess ground-water level changes in the area of Anza and Terwilliger between 2004 and 2005.
Fluorescein and Rhodamine WT dye-tracer injections were performed in Monroe County, West Virginia to determine groundwater flow paths and identify the location of the groundwater divide within the Greenbrier karst aquifer in the area south of Union, West Virginia. Fluorescein was injected in a swallet on Burnside Branch upstream of Steel's cave (37° 33' 56.0" latitude -80° 32' 57.6" longitude) and Rhodamine WT was injected into a swallet at the contact of the Hillsdale Limestone and Maccrady Shale in the headwaters of Taggart Branch (37° 33' 17.8" latitude -80° 28' 29.0" longitude). Data collected from these tracer injections supported interpretations made by Jones (1997) with some refinements. The first table contains...
Categories: Data;
Tags: Hydrology,
Monroe County,
USGS Science Data Catalog (SDC),
West Virginia,
biota,
The coastal region which includes areas within the Pee Dee, Cape Fear, and Neuse-Pamlico River Basins in South Carolina and North Carolina was chosen as a focus area study (FAS) for the U.S. Geological Survey (USGS) National Water Census (NWC) in 2016. The objective of the NWC is to place technical information and tools in the hands of stake holders so that they can make informed decisions on water availability. The USGS South Atlantic Water Science Center, comprised of North Carolina, South Carolina, and Georgia, conducted a 3-year study of water use and availability, climate change, and population growth to provide information related to the competing societal and ecological water needs in the Southeastern Atlantic...
Categories: Data;
Tags: Atlantic Coastal Plain,
Brunswick, Georgia,
GA,
Georgia,
Greenville, North Carolina,

These data were released prior to the October 1, 2016 effective date for the USGS’s policy dictating the review, approval, and release of scientific data as referenced in USGS Survey Manual Chapter 502.8 Fundamental Science Practices: Review and Approval of Scientific Data for Release. MDWU98 is a point coverage that represents the locations of wells for the State of Maryland that are permitted to withdraw 10,000 gallons or more per day by the Maryland Department of the Environment (MDE). Each site has the permit number, permit amount, reported withdrawal, aquifer code, and type of use. Information contained in the dataset comes from the U.S.Geological Survey site-specific water-use database (SWUDS).
Categories: pre-SM502.8;
Tags: Ground-water,
Maryland,
NSDI,
USGS Science Data Catalog (SDC),
Water-use,

These data were released prior to the October 1, 2016 effective date for the USGS’s policy dictating the review, approval, and release of scientific data as referenced in USGS Survey Manual Chapter 502.8 Fundamental Science Practices: Review and Approval of Scientific Data for Release. During 2008, the U.S. Geological Survey and other agencies made approximately 2,500 water-level measurements in the Mojave River and Morongo groundwater basins. These data document recent conditions and, when compared with previous data, changes in groundwater levels. A water-level contour map was drawn using data from about 700 wells, providing coverage for most of the basins. Twenty-four hydrographs show long-term (up to 70 years)...

These data were released prior to the October 1, 2016 effective date for the USGS’s policy dictating the review, approval, and release of scientific data as referenced in USGS Survey Manual Chapter 502.8 Fundamental Science Practices: Review and Approval of Scientific Data for Release. The USGS compiles online access to water-resources data collected at approximately 1.5 million sites in all 50 States, the District of Columbia, Puerto Rico, the Virgin Islands, Guam, American Samoa and the Commonwealth of the Northern Mariana Islands.
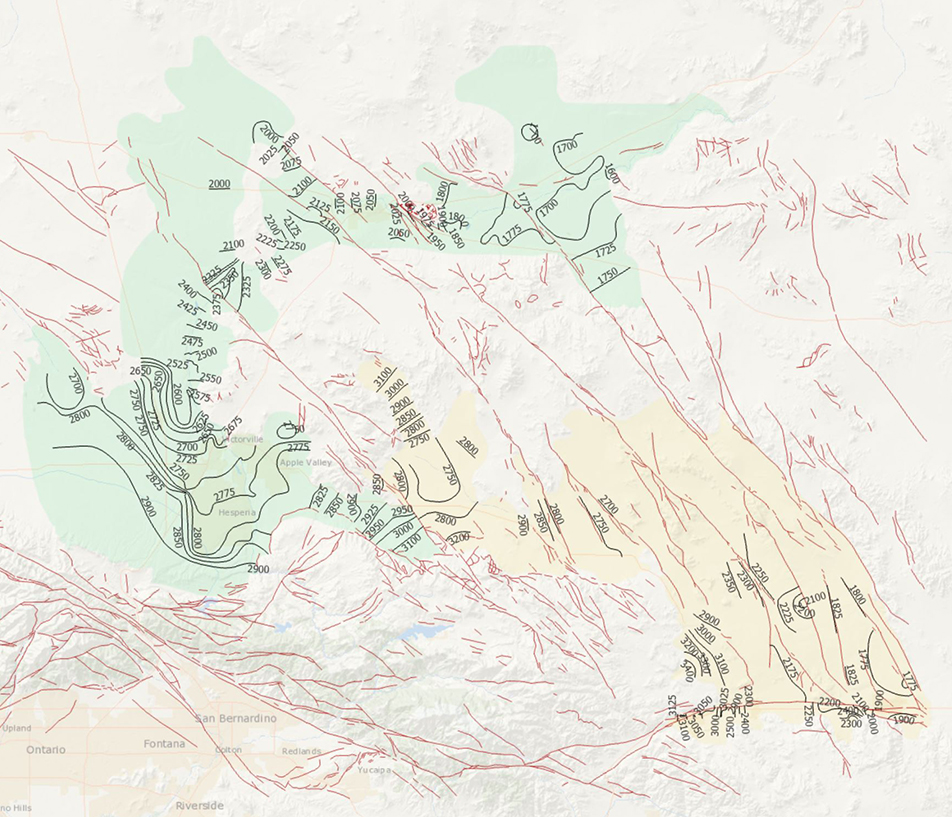
During 2014, the U.S. Geological Survey and other agencies made approximately 1,026 water-level measurements in the Mojave River and Morongo groundwater basins. These data document recent conditions and, when compared with previous data, changes in groundwater levels. A water-level contour map was drawn using data from about 610 wells, providing coverage for most of the basins. Twenty-four hydrographs show long-term (1930-2014) water-level conditions throughout the basins, and 9 short-term (1992 to 2014) hydrographs show the effects of recharge and discharge along the Mojave River. In addition, a water-level-change map was compiled to compare was compiled to compare the 2014 water levels to the 2012 water levels...
Categories: Data Release - Revised;
Tags: USGS,
USGS Science Data Catalog (SDC),
contours,
drainage basin,
ground water,

These data were released prior to the October 1, 2016 effective date for the USGS’s policy dictating the review, approval, and release of scientific data as referenced in USGS Survey Manual Chapter 502.8 Fundamental Science Practices: Review and Approval of Scientific Data for Release. The Mojave River and Morongo ground-water basins are in the southwestern part of the Mojave Desert in southern California. Ground water from these basins supplies a major part of the water requirements for the region. The continuous population growth in this area has resulted in ever-increasing demands on local ground-water resources. The collection and interpretation of ground-water data helps local water districts, military bases,...
This layer shows the potentiometric surface contours of the Upper Floridan Aquifer in Florida and parts of Georgia, South Carolina, and Alabama in May 2010. Contours were manually contoured from well elevation data collected in May-June 2010. This layer was updated in August 2014 to include south Florida by calculating the equivalant freshwater head where water quality data was available.
Categories: Data;
Types: Downloadable,
Map Service,
OGC WFS Layer,
OGC WMS Layer,
Shapefile;
Tags: Alabama,
Florida,
Floridan aquifer,
Georgia,
Ground-water,
Groundwater basin divides within the Floridan Aquifer System include the Dougherty Plain Apalachicola, Southeast Georgia, Northeast Florida, South Carolina, Panhandle, Thomsville-Tallahasse Suwannee, West Central Florida, East Central Florida and South Florida.
Categories: Data;
Types: Downloadable,
Map Service,
OGC WFS Layer,
OGC WMS Layer,
Shapefile;
Tags: Alabama,
Florida,
Floridan aquifer,
Georgia,
Ground-water,

These data were released prior to the October 1, 2016 effective date for the USGS’s policy dictating the review, approval, and release of scientific data as referenced in USGS Survey Manual Chapter 502.8 Fundamental Science Practices: Review and Approval of Scientific Data for Release. During 2012, the U.S. Geological Survey and other agencies made approximately 2,500 water-level measurements in the Mojave River and Morongo groundwater basins. These data document recent conditions and, when compared with previous data, changes in groundwater levels. A water-level contour map was drawn using data from about 575 wells, providing coverage for most of the basins. Twenty-eight hydrographs show long-term (1930-2012)...

These data were released prior to the October 1, 2016 effective date for the USGS’s policy dictating the review, approval, and release of scientific data as referenced in USGS Survey Manual Chapter 502.8 Fundamental Science Practices: Review and Approval of Scientific Data for Release. During 2006, the U.S. Geological Survey and other agencies made approximately 2,500 water-level measurements in the Mojave River and Morongo ground-water basins. These data document recent conditions and, when compared with previous data, changes in ground-water levels. A water-level contour map was drawn using data from about 680 wells, providing coverage for most of the basins. Twenty-five hydrographs show long-term (up to 70 years)...
|

|
