Filters: Tags: Gunnison County (X)
394 results (79ms)|
Filters
Date Range
Extensions Types
Contacts
Categories Tag Types
|
Layers of geospatial data include contours, boundaries, land cover, hydrography, roads, transportation, geographic names, structures, and other selected map features.
Layers of geospatial data include contours, boundaries, land cover, hydrography, roads, transportation, geographic names, structures, and other selected map features.
Layers of geospatial data include contours, boundaries, land cover, hydrography, roads, transportation, geographic names, structures, and other selected map features.
Layers of geospatial data include contours, boundaries, land cover, hydrography, roads, transportation, geographic names, structures, and other selected map features.
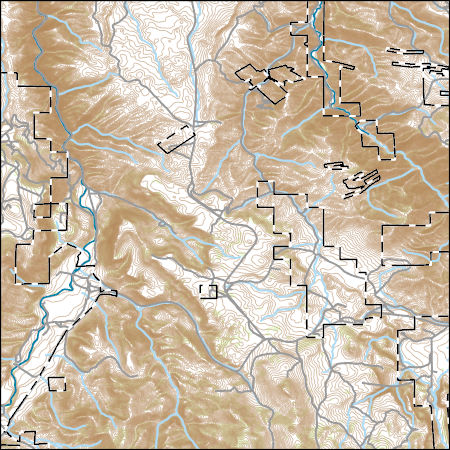
Layers of geospatial data include contours, boundaries, land cover, hydrography, roads, transportation, geographic names, structures, and other selected map features.
This U.S. Geological Survey (USGS) data release contains strontium isotopic data from water and rock samples collected between 2000 and 2019 from the Mount Emmons area, central Colorado. The data include strontium isotopic compositions, 87Sr/86Sr, for surface- and groundwater samples collected from streams, springs, draining mines, piezometers, and drill holes and for leachates of rock samples collected from surface outcrops and drill core. Rock sample isotopic data are results from two-step leaching of samples from various lithologies within the study area. Drill core rock and water samples were collected from holes drilled in 2017 and 2018 as part of a U.S. Geological Survey and Department of Energy investigation...
Categories: Data;
Tags: Colorado,
Crested Butte,
Economic Geology,
Elk Mountains,
Geology, Geophysics, and Geochemistry Science Center (GGGSC),
Digitization of oil and gas well pad sites in the Piceance region of Western Colorado. Well pad sites were delineated using a modified version of the Rapid Land Cover Mapping protocol (Preston and Kim, 2016). The base imagery used to delineate boundaries is the 2015 National Agriculture Imagery Program (NAIP) imagery. Well coordinate locations facilitating the targeting of well pad sites were downloaded from the Colorado Oil and Gas Conservation Commission (COGCC) in February 2016. Preston, Todd M, and Kevin Kim. 2016. “Land Cover Changes Associated with Recent Energy Development in the Williston Basin; Northern Great Plains , USA.” Science of the Total Environment 566-567. Elsevier B.V.: 1511–18. doi:10.1016/j.scitotenv.2016.06.038.
Categories: Data;
Types: Downloadable,
Map Service,
OGC WFS Layer,
OGC WMS Layer,
Shapefile;
Tags: Colorado,
Delta County,
Energy Resources,
Garfield County,
Gunnison County,
Mitigating the effects of salinity (total dissolved solids) and selenium on water quality in the lower Gunnison River Basin (LGRB) of western Colorado is a major concern for land managers. In cooperation with the Bureau of Reclamation, the U.S. Geological Survey completed a study to develop multiple linear regression models to estimate salinity and selenium loads. The objective of the study was to refine existing models by improving the regressions and using additional geospatial and water-quality data. This data release presents the basin characteristics and loads used to calibrate the models. Also provided are salinity and selenium yield rasters determined by empirical Bayesian kriging of loads estimated by the...
GUNNISON RIVER AT CNTY RD 32 BELOW GUNNISON, CO
EAST RIVER BELOW CEMENT CREEK NR CRESTED BUTTE, CO
The U.S. Geological Survey collected low-altitude airborne thermal infrared data and visual imagery via a multirotor, small unoccupied aircraft system deployed from the northern bank of Oh-be-joyful Creek and adjacent to the Peeler fault, approximately 6 kilometers northwest of the town of Crested Butte, in Gunnison National Forest, Colorado, on August 17, 2017. Thermal infrared still images were collected in jpg and radiometric tiff formats, and non-radiometric thermal infrared video was collected. The radiometric thermal infrared still images were compiled automatically into a larger stitched image (orthomosaic). Visual imagery was collected in jpg format, and the images were compiled automatically into a larger...
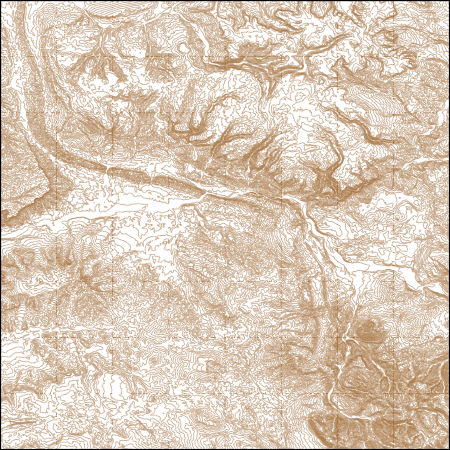
These vector contour lines are derived from the 3D Elevation Program using automated and semi-automated processes. They were created to support 1:24,000-scale CONUS and Hawaii, 1:25,000-scale Alaska, and 1:20,000-scale Puerto Rico / US Virgin Island topographic map products, but are also published in this GIS vector format. Contour intervals are assigned by 7.5-minute quadrangle, so this vector dataset is not visually seamless across quadrangle boundaries. The vector lines have elevation attributes (in feet above mean sea level on NAVD88), but this dataset does not carry line symbols or annotation.
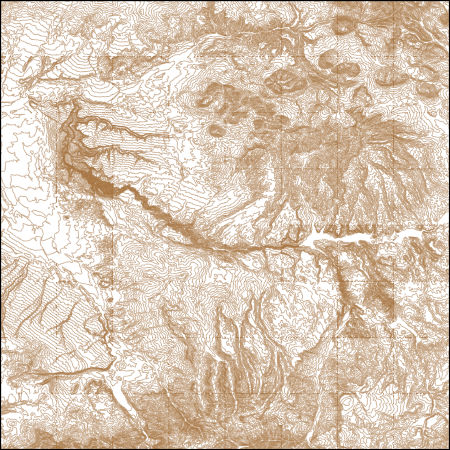
These vector contour lines are derived from the 3D Elevation Program using automated and semi-automated processes. They were created to support 1:24,000-scale CONUS and Hawaii, 1:25,000-scale Alaska, and 1:20,000-scale Puerto Rico / US Virgin Island topographic map products, but are also published in this GIS vector format. Contour intervals are assigned by 7.5-minute quadrangle, so this vector dataset is not visually seamless across quadrangle boundaries. The vector lines have elevation attributes (in feet above mean sea level on NAVD88), but this dataset does not carry line symbols or annotation.
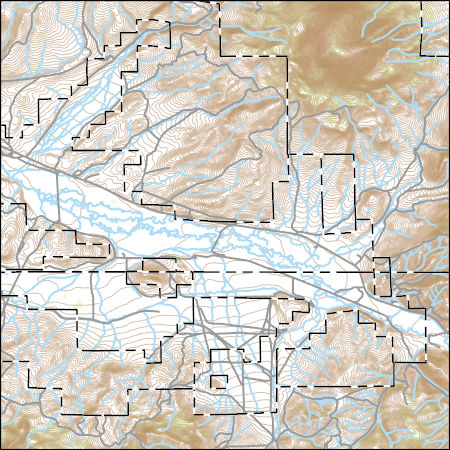
Layers of geospatial data include contours, boundaries, land cover, hydrography, roads, transportation, geographic names, structures, and other selected map features.
Layers of geospatial data include contours, boundaries, land cover, hydrography, roads, transportation, geographic names, structures, and other selected map features.
Layers of geospatial data include contours, boundaries, land cover, hydrography, roads, transportation, geographic names, structures, and other selected map features.
Layers of geospatial data include contours, boundaries, land cover, hydrography, roads, transportation, geographic names, structures, and other selected map features.
Layers of geospatial data include contours, boundaries, land cover, hydrography, roads, transportation, geographic names, structures, and other selected map features.
Layers of geospatial data include contours, boundaries, land cover, hydrography, roads, transportation, geographic names, structures, and other selected map features.
Layered geospatial PDF 7.5 Minute Quadrangle Map. Layers of geospatial data include orthoimagery, roads, grids, geographic names, elevation contours, hydrography, and other selected map features. This map is derived from GIS (geospatial information system) data. It represents a repackaging of GIS data in traditional map form, not creation of new information. The geospatial data in this map are from selected National Map data holdings and other government sources.
|

|
