Filters: Tags: Gwinnett County (X)
79 results (118ms)|
Filters
Date Range
Types Contacts
Categories Tag Types Tag Schemes |
Layers of geospatial data include contours, boundaries, land cover, hydrography, roads, transportation, geographic names, structures, and other selected map features.
Layers of geospatial data include contours, boundaries, land cover, hydrography, roads, transportation, geographic names, structures, and other selected map features.
Specific activities of cesium-137 (half life = 30.17 years), lead-210 (half life = 22.3 years), radium-226 (half life = 1,600 years), thorium-234 (half life = 24.1 days), and potassium-40 (half life = 1.277 billion years) in disintegrations per minute per gram (dpm/g) were determined for the Lake Lanier cores. The laboratory errors (plus or minus) and the critical levels are included for each sample.
This dataset contains the daily average base flow, as determined by hydrograph separation, for 14 watersheds in Gwinnett County, Georgia for October 2001 through September 2020. Hydrograph separations were done using the Web-based Hydrograph Analysis Tool (WHAT) using the simple local minimum method on the daily average streamflows, which are also provided in this dataset. Base flow along with the calculated base-flow index (the proportion of base flow to total flow) were used to characterize groundwater recharge and the relative degree of storm runoff in the watersheds. Base flow was also used as predictor variable in models for estimating streamwater constituent loads for 12 water-quality constituents at 13 of...
Categories: Data;
Types: Map Service,
OGC WFS Layer,
OGC WMS Layer,
OGC WMS Service;
Tags: Gwinnett County,
State of Georgia,
datasets,
inlandWaters,
streamflow,
This Geographic Information System dataset contains shapefiles of 200-foot stream buffers for the 15 study watersheds in Gwinnett County, Georgia. The stream buffers are based on flowlines from the high resolution, 1:24,000-scale National Hydrography Dataset.
This dataset contains a list of outlier sample concentrations identified for 17 water quality constituents from streamwater sample collected at 15 study watersheds in Gwinnett County, Georgia for water years 2003 to 2020. The 17 water quality constituents are: biochemical oxygen demand (BOD), chemical oxygen demand (COD), total suspended solids (TSS), suspended sediment concentration (SSC), total nitrogen (TN), total nitrate plus nitrite (NO3NO2), total ammonia plus organic nitrogen (TKN), dissolved ammonia (NH3), total phosphorus (TP), dissolved phosphorus (DP), total organic carbon (TOC), total calcium (Ca), total magnesium (Mg), total copper (TCu), total lead (TPb), total zinc (TZn), and total dissolved solids...
Categories: Data;
Types: Map Service,
OGC WFS Layer,
OGC WMS Layer,
OGC WMS Service;
Tags: Gwinnett County,
State of Georgia,
inlandWaters,
surface water quality
Layers of geospatial data include contours, boundaries, land cover, hydrography, roads, transportation, geographic names, structures, and other selected map features.
Layers of geospatial data include contours, boundaries, land cover, hydrography, roads, transportation, geographic names, structures, and other selected map features.

These vector contour lines are derived from the 3D Elevation Program using automated and semi-automated processes. They were created to support 1:24,000-scale CONUS and Hawaii, 1:25,000-scale Alaska, and 1:20,000-scale Puerto Rico / US Virgin Island topographic map products, but are also published in this GIS vector format. Contour intervals are assigned by 7.5-minute quadrangle, so this vector dataset is not visually seamless across quadrangle boundaries. The vector lines have elevation attributes (in feet above mean sea level on NAVD88), but this dataset does not carry line symbols or annotation.
Layers of geospatial data include contours, boundaries, land cover, hydrography, roads, transportation, geographic names, structures, and other selected map features.
Layers of geospatial data include contours, boundaries, land cover, hydrography, roads, transportation, geographic names, structures, and other selected map features.
Layers of geospatial data include contours, boundaries, land cover, hydrography, roads, transportation, geographic names, structures, and other selected map features.
Layered geospatial PDF 7.5 Minute Quadrangle Map. Layers of geospatial data include orthoimagery, roads, grids, geographic names, elevation contours, hydrography, and other selected map features. This map is derived from GIS (geospatial information system) data. It represents a repackaging of GIS data in traditional map form, not creation of new information. The geospatial data in this map are from selected National Map data holdings and other government sources.
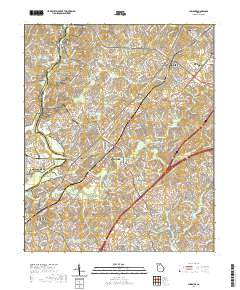
Layered geospatial PDF 7.5 Minute Quadrangle Map. Layers of geospatial data include orthoimagery, roads, grids, geographic names, elevation contours, hydrography, and other selected map features. This map is derived from GIS (geospatial information system) data. It represents a repackaging of GIS data in traditional map form, not creation of new information. The geospatial data in this map are from selected National Map data holdings and other government sources.
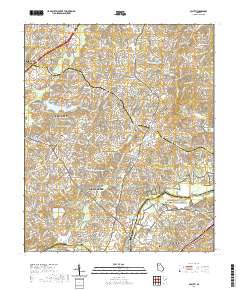
Layered geospatial PDF 7.5 Minute Quadrangle Map. Layers of geospatial data include orthoimagery, roads, grids, geographic names, elevation contours, hydrography, and other selected map features. This map is derived from GIS (geospatial information system) data. It represents a repackaging of GIS data in traditional map form, not creation of new information. The geospatial data in this map are from selected National Map data holdings and other government sources.
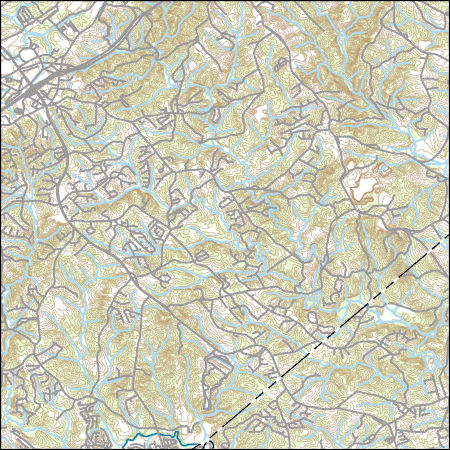
Layers of geospatial data include contours, boundaries, land cover, hydrography, roads, transportation, geographic names, structures, and other selected map features.
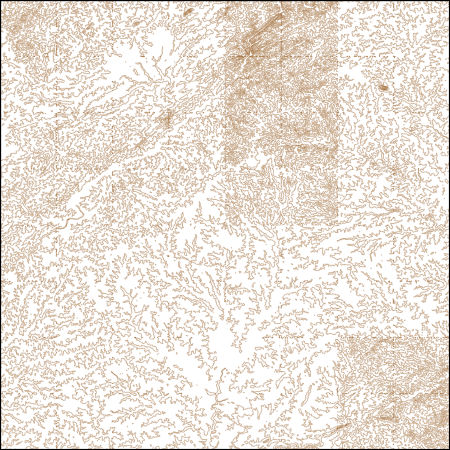
These vector contour lines are derived from the 3D Elevation Program using automated and semi-automated processes. They were created to support 1:24,000-scale CONUS and Hawaii, 1:25,000-scale Alaska, and 1:20,000-scale Puerto Rico / US Virgin Island topographic map products, but are also published in this GIS vector format. Contour intervals are assigned by 7.5-minute quadrangle, so this vector dataset is not visually seamless across quadrangle boundaries. The vector lines have elevation attributes (in feet above mean sea level on NAVD88), but this dataset does not carry line symbols or annotation.

Layers of geospatial data include contours, boundaries, land cover, hydrography, roads, transportation, geographic names, structures, and other selected map features.
Layers of geospatial data include contours, boundaries, land cover, hydrography, roads, transportation, geographic names, structures, and other selected map features.
The dataset contains model coefficients and statistics for the 488 regression models used to estimate streamwater constituent loads for 13 watersheds in Gwinnett County, Georgia for two calibration periods, water years 2003-2010 and 2010-2020. Model terms were selected from an 11-parameter equation, which was a function of discharge, base flow, season, turbidity, and time (trend), using a forward stepwise ordinary least squares regression approach. Model coefficients were fit using U.S. Geological Survey (USGS) LOADEST load estimation software. Models were fit both with and without turbidity explanatory variables for 12 water-quality constituents: total suspended solids, suspended sediment concentration, total nitrogen,...
Categories: Data;
Types: Map Service,
OGC WFS Layer,
OGC WMS Layer,
OGC WMS Service;
Tags: Gwinnett County,
State of Georgia,
inlandWaters,
mathematical modeling,
streamflow,
|

|
