Filters: Tags: HANFORD (X)
40 results (50ms)|
Filters
Date Range
Extensions Types Contacts
Categories Tag Types Tag Schemes |
This data set contains imagery from the National Agriculture Imagery Program (NAIP). The NAIP program is administered by USDA FSA and has been established to support two main FSA strategic goals centered on agricultural production. These are, increase stewardship of America's natural resources while enhancing the environment, and to ensure commodities are procured and distributed effectively and efficiently to increase food security. The NAIP program supports these goals by acquiring and providing ortho imagery that has been collected during the agricultural growing season in the U.S. The NAIP ortho imagery is tailored to meet FSA requirements and is a fundamental tool used to support FSA farm and conservation programs....
This data set contains imagery from the National Agriculture Imagery Program (NAIP). The NAIP program is administered by USDA FSA and has been established to support two main FSA strategic goals centered on agricultural production. These are, increase stewardship of America's natural resources while enhancing the environment, and to ensure commodities are procured and distributed effectively and efficiently to increase food security. The NAIP program supports these goals by acquiring and providing ortho imagery that has been collected during the agricultural growing season in the U.S. The NAIP ortho imagery is tailored to meet FSA requirements and is a fundamental tool used to support FSA farm and conservation programs....
This data release provides access to a low-altitude, aeromagnetic survey of a part of south-central Washington centered approximately 30 km east of Yakima and referred to as the Hanford aeromagnetic survey. The survey includes the city of Richland, numerous smaller communities, and the Hanford Site (https://www.hanford.gov). The Hanford aeromagnetic survey extends from the Columbia Plateau westward to the Cascade Range and illuminates magnetic anomalies associated with folds and faults of the Yakima folds, including the Toppenish Ridge, Ahtanum Ridge, Umtanum Ridge, Boyleston Mountain, Rattlesnake Mountain, Saddle Mountains, and Frenchman Hills anticlines. These data were acquired during September and October, 2009,...
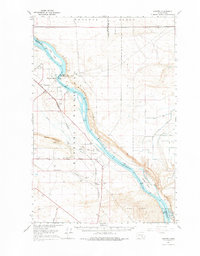
USGS Historical Quadrangle in GeoPDF.
This paper aims to provide a better understanding of the current situation of natural resources consumption in the world and its relationship with the level of social development. The Ecological Footprint concept is used to indicate human beings' environmental impact, and the Human Development Index (HDI) is used as a process for the social development level. Based on the dataset of 136 countries from the World Wildlife Fund (WWF), we calculate the Gini coefficients of the total Ecological Footprint per person (EF) and its sub items, i.e., Renewable Resources Footprint per person (REF) and Energy Footprint per person (EEF). The results indicate that significant inequality exists in natural resources consumption...
This data set contains imagery from the National Agriculture Imagery Program (NAIP). The NAIP program is administered by USDA FSA and has been established to support two main FSA strategic goals centered on agricultural production. These are, increase stewardship of America's natural resources while enhancing the environment, and to ensure commodities are procured and distributed effectively and efficiently to increase food security. The NAIP program supports these goals by acquiring and providing ortho imagery that has been collected during the agricultural growing season in the U.S. The NAIP ortho imagery is tailored to meet FSA requirements and is a fundamental tool used to support FSA farm and conservation programs....
Types: Citation;
Tags: 19033,
3.75 x 3.75 minute,
4309363,
Aerial Compliance,
CERRO GORDO CO IA FSA,
This data set contains imagery from the National Agriculture Imagery Program (NAIP). The NAIP program is administered by USDA FSA and has been established to support two main FSA strategic goals centered on agricultural production. These are, increase stewardship of America's natural resources while enhancing the environment, and to ensure commodities are procured and distributed effectively and efficiently to increase food security. The NAIP program supports these goals by acquiring and providing ortho imagery that has been collected during the agricultural growing season in the U.S. The NAIP ortho imagery is tailored to meet FSA requirements and is a fundamental tool used to support FSA farm and conservation programs....
Metals contamination from mining activities is a persistent problem affecting aquatic ecosystems throughout mining districts in the western USA. The Gold Creek drainage in northern Idaho has a history of mining within its headwaters and contains elevated sediment concentrations of As, Cd, Cu, Pb, and Zn. To determine system-wide impacts of increased metals, we measured concentrations of metals in water, sediment, and benthic macroinvertebrate tissues and related them to whole-body fish tissues and histopathological alterations in native salmonids. Water concentrations were higher than those in reference areas, but were below water quality criteria for protection of aquatic biota for most of the study area. Sediment...
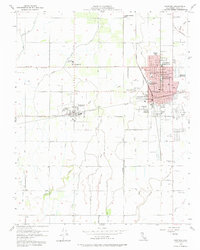
USGS Historical Quadrangle in GeoPDF.
This data set contains imagery from the National Agriculture Imagery Program (NAIP). The NAIP program is administered by USDA FSA and has been established to support two main FSA strategic goals centered on agricultural production. These are, increase stewardship of America's natural resources while enhancing the environment, and to ensure commodities are procured and distributed effectively and efficiently to increase food security. The NAIP program supports these goals by acquiring and providing ortho imagery that has been collected during the agricultural growing season in the U.S. The NAIP ortho imagery is tailored to meet FSA requirements and is a fundamental tool used to support FSA farm and conservation programs....
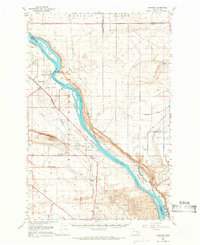
USGS Historical Quadrangle in GeoPDF.
In the 300 Area of a U(VI)-contaminated aquifer at Hanford, Washington, USA, inorganic carbon and major cations, which have large impacts on U(VI) transport, change on an hourly and seasonal basis near the Columbia River. Batch and column experiments were conducted to investigate the factors controlling U(VI) adsorption/desorption by changing chemical conditions over time. Low alkalinity and low Ca concentrations (Columbia River water) enhanced adsorption and reduced aqueous concentrations. Conversely, high alkalinity and high Ca concentrations (Hanford groundwater) reduced adsorption and increased aqueous concentrations of U(VI). An equilibrium surface complexation model calibrated using laboratory batch experiments...
Categories: Publication;
Types: Citation;
Tags: Hanford,
Kine,
groundwater–surface water interaction
The ability of selenium (Se) to moderate mercury (Hg) toxicity is well established in the literature. Mercury exposures that might otherwise produce toxic effects are counteracted by Se, particularly when Se:Hg molar ratios approach or exceed 1. We analyzed whole body Se and Hg concentrations in 468 fish representing 40 species from 137 sites across 12 western U.S. states. The fish samples were evaluated relative to a published wildlife protective Hg threshold (0.1 Delta *mg Hg.g-1 wet wt.), the current tissue based methylmercury (MeHg) water quality criterion (WQC) for the protection of humans (0.3 Delta *mg Hg.g-1 wet wt.) and to presumed protections against Hg toxicity when Se:Hg molar ratios are >1. A large...
This data set contains imagery from the National Agriculture Imagery Program (NAIP). The NAIP program is administered by USDA FSA and has been established to support two main FSA strategic goals centered on agricultural production. These are, increase stewardship of America's natural resources while enhancing the environment, and to ensure commodities are procured and distributed effectively and efficiently to increase food security. The NAIP program supports these goals by acquiring and providing ortho imagery that has been collected during the agricultural growing season in the U.S. The NAIP ortho imagery is tailored to meet FSA requirements and is a fundamental tool used to support FSA farm and conservation programs....
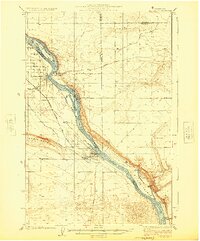
USGS Historical Quadrangle in GeoPDF.
This data set contains imagery from the National Agriculture Imagery Program (NAIP). The NAIP program is administered by USDA FSA and has been established to support two main FSA strategic goals centered on agricultural production. These are, increase stewardship of America's natural resources while enhancing the environment, and to ensure commodities are procured and distributed effectively and efficiently to increase food security. The NAIP program supports these goals by acquiring and providing ortho imagery that has been collected during the agricultural growing season in the U.S. The NAIP ortho imagery is tailored to meet FSA requirements and is a fundamental tool used to support FSA farm and conservation programs....
This data set contains imagery from the National Agriculture Imagery Program (NAIP). The NAIP program is administered by USDA FSA and has been established to support two main FSA strategic goals centered on agricultural production. These are, increase stewardship of America's natural resources while enhancing the environment, and to ensure commodities are procured and distributed effectively and efficiently to increase food security. The NAIP program supports these goals by acquiring and providing ortho imagery that has been collected during the agricultural growing season in the U.S. The NAIP ortho imagery is tailored to meet FSA requirements and is a fundamental tool used to support FSA farm and conservation programs....
Environmental surveillance on and around the Hanford Site, located in southeastern Washington State, is conducted by the Pacific Northwest National Laboratory, which is operated by Battelle for the U.S. Department of Energy. These data collected provide a historical record of radionuclide and radiation levels attributable to natural causes, worldwide fallout, and Hanford Site operations. Data were also collected to monitor several chemicals and metals in Columbia River water, sediment, and wildlife. For more information regarding the 2006 sampling schedule for the Surface Environmental Surveillance Project and Drinking Water Monitoring Project, refer to Hanford Site Environmental Surveillance Master Sampling Schedule...
|

|
