Filters: Tags: Habitat Characterization (X)
29 results (50ms)|
Filters
Date Range
Extensions (Less) Types (Less)
Contacts (Less)
Categories (Less) Tag Types
|
This dataset provides the results of an assessment of estuary habitat condition in the conterminous United States. To analyze estuary condition, a cumulative disturbance index was developed based on habitat stressor variable data available at a national scale for anthropogenic disturbances measured within estuaries and their associated watersheds. Twenty-eight variables were combined within stressor categories to develop four sub-indices of disturbance for land use, alterations of river flows, pollution sources, and estuary eutrophication. These four sub-indices of disturbance were then combined to develop cumulative disturbance index scores for each estuary. This index describes the estimated combined stress on...
This data release provides the georeferenced boundaries that delimit each spatial unit of the Great Lakes Regional Aquatic Gap Analysis Project (GLGap) Coastal Hydrospatial Framework at each spatial scale from the local 90m cell to the entire Laurentian Great Lakes system and from the shoreline to the deepest offshore waters. The U.S. Geological Survey and the U.S. Fish and Wildlife Service collaborated to design a universal framework of spatial areas that encompass all space of the Laurentian Great Lakes proper. Agglomeration of the finest units (90m cells) form coarser, broader scale units. Finer units are nested within the coarser units at six spatial scales, labeled as Local Cells, Aquatic Habitat Areas, Coastal...
This ArcGIS Map Package contains information on brook trout occupancy in the southern portion of the brook trout range (PA and south). Fish sample data from a number of state and federal agencies/organizations were used to define patches for brook trout as groups of occupied contiguous catchment polygons from the National Hydrography Dataset Plus Version 1 (NHDPlusV1) catchment GIS layer. After defining patches, NHDPlusV1 catchments were assigned occupancy codes. Then state and federal agencies reviewed patches and codes to verify data accuracy. A similar effort is currently being conducted by the Eastern Brook Trout Joint Venture to develop occupancy data for the remainder of the brook trout range including states...
Categories: Data;
Types: ArcGIS Map Package,
ArcGIS REST Map Service,
ArcGIS Service Definition,
Downloadable,
Map Service;
Tags: Biological Data,
Direct habitat alteration,
EBTJV,
FHP Product,
Georgia,
Atlantic Coastal Fish Habitat Partnership (ACFHP) is currently working on a project with the University of Maryland Eastern Shore through a grant from the Mid-Atlantic Fishery Management Council to study the relationship between black sea bass abundance and habitat characteristics in the Mid-Atlantic Bight. Data are being collected on black sea bass abundance, stomach contents, and position in the food web, as well as characteristics of the habitats black sea bass are associated with: bottom type, whether a reef is natural or artificial, and the plants, animals, and algae attached to each habitat. This work will lead to a better understand of the importance of habitat and prey community structure on black sea bass...
This shapefile contains fish habitat condition index (HCI) scores as well as specific disturbance indices for 6th level Hydrologic Unit Code (HUC12) watersheds of the Watershed Boundary Dataset. The source datasets compiled and attributed to spatial units were identified as being: (1) meaningful for assessing fluvial fish habitat; (2) consistent across the entire study area in the way that they were assembled; (3) broadly representative of conditions in the past 10 years, and (4) of sufficient spatial resolution that they could be used to make valid comparisons among HUC12 units. In this data set, variable summaries are linked to HUC12 watersheds developed for the Watershed Boundary Dataset downloaded on March 18,...
Categories: Data;
Types: ArcGIS REST Map Service,
Map Service;
Tags: 2015 National Assessment,
2015 National Assessment,
DataProduct,
Direct habitat alteration,
Environmental condition,
Accruate mapping of tidal wetlands is vital for effective conservation and restoration of these valued habitats, and good mapping is key to strategic planning for coastal resilience. Tidal wetlands are defined by regular inundation by the tides; therefore, mapping of tidal wetlands should be based on knowledge of tidal water levels and the land areas inundated by the tides. We developed this tidal wetland mapping following that principle. Briefly, we used a method developed in Oregon that combines NOAA’s extreme water level models with high-resolution LIDAR digital elevation models (DEMs) to map areas subject to tidal inundation. We refined the mapping using additional data sources such as the National Wetland...
Categories: Data;
Types: ArcGIS REST Map Service,
Map Service;
Tags: FHP Product,
Habitat Characterization,
Hydrologic alteration,
Marine,
NFHP Cooperator,
This shapefile contains cumulative fish habitat condition index (HCI) scores as well as specific disturbance indices for local and network catchments of Southeast Alaska. Catchments were created in support of Jared Ross's Master’s thesis. The source datasets compiled and attributed to spatial units were identified as being: (1) meaningful for assessing fluvial fish habitat; (2) consistent across the entire study area in the way that they were assembled; (3) broadly representative of conditions in the past 10 years, and (4) of sufficient spatial resolution that they could be used to make valid comparisons among local catchment units. Citations: Ross, J.A. Influences of timber management and natural landscape factors...
Categories: Data;
Types: ArcGIS REST Map Service,
Citation,
Map Service;
Tags: 2015 National Assessment,
2015 National Assessment,
DataProduct,
Direct habitat alteration,
Environmental condition,
This CSV file contains cumulative fish habitat condition index (HCI) scores generated for river reaches of the conterminous United States as well as indices generated specifically for four spatial units including local and network catchments and 90 m local and network buffers of river reaches. Note that the cumulative HCI score is determined from limiting index scores generated for the four spatial units listed above. Detailed methods for calculating cumulative fish habitat condition index scores as well as the indices for each spatial extent can be found on the following website: http://assessment.fishhabitat.org/: The variables used to create indices in catchments vs. buffers differ due to differences in resolution...
Categories: Data;
Types: ArcGIS REST Map Service,
Map Service;
Tags: 2015 National Assessment,
2015 National Assessment,
Alabama,
Anthropogenic factors,
Aquatic habitats,
Abstract (from http://www.springerplus.com/content/3/1/589): The growing quality and availability of spatial map layers (e.g., climate, geology, and land use) allow stream studies, which historically have occurred over small areas like a single watershed or stream reach, to increasingly explore questions from a landscape perspective. This large-scale perspective for fluvial studies depends on the ability to characterize influences on streams resulting from throughout entire upstream networks or catchments. While acquiring upstream information for a single reach is relatively straight-forward, this process becomes demanding when attempting to obtain summaries for all streams throughout a stream network and across...
Categories: Publication;
Types: Citation;
Tags: Aggregation,
Digitized stream network,
GIS,
Habitat Characterization,
Landscape information,
This point layer represents estuaries present within PMEP’s spatial data system. This layer was developed by members of PMEP, based partly on previous estuary inventory efforts as well asthe goals of PMEP. Currently, there are 444 estuaries present in this layer, covering the West Coast of the contiguous United States. Estuaries were included based on their current or future potential to provide habitat for fish species. It is possible that this list will expand or contract over time, as determined by the needs of PMEP.
Categories: Data;
Types: ArcGIS REST Map Service,
Map Service;
Tags: FHP Product,
Habitat Characterization,
Marine,
NFHP Cooperator,
PMEP,
This CSV file contains landscape factors representing anthropogenic disturbances to stream habitats summarized within 6th level Hydrologic Unit Code (HUC12) watersheds of the Watershed Boundary Dataset. The source datasets compiled and attributed to spatial units were identified as being: (1) meaningful for assessing fluvial fish habitat; (2) consistent across the entire study area in the way that they were assembled; (3) broadly representative of conditions in the past 10 years, and (4) of sufficient spatial resolution that they could be used to make valid comparisons among local catchment units. Variables summarized at the HUC12 scale include measures of anthropogenic land uses, population density, roads, dams,...
Categories: Data;
Types: ArcGIS REST Map Service,
ArcGIS Service Definition,
Downloadable,
Map Service;
Tags: 2015 National Assessment,
2015 National Assessment,
Alaska,
Anthropogenic factors,
DataProduct,
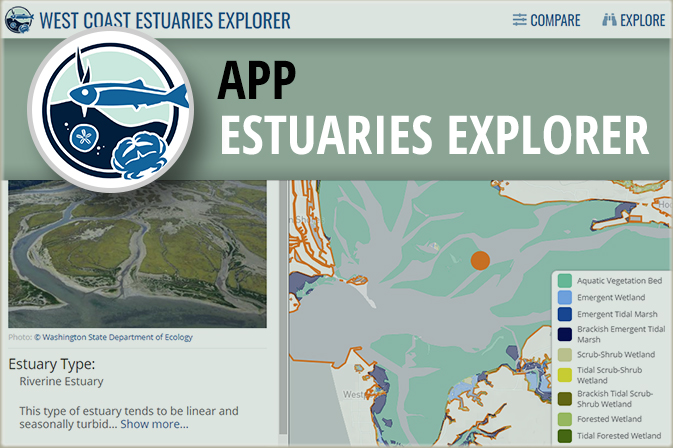
This application enables you to compare estuaries to each other along the coastlines of Washington, Oregon, and California. You can combine dynamic filters and an interactive map to find specific estuary types you are interested in, such as large river delta estuaries which often have extensive diking; small, riverine estuaries that are at the lowest risk to fish habitat degradation; or estuaries contain species that interest you. Only want to compare estuaries in a specific area? Simply zoom the map in to that area, and the filters automatically update to show you the number of estuaries in that area that meet different conditions. You can also explore estuaries in more detail to find a specific estuary by name...
This CSV file contains landscape factors representing anthropogenic disturbances to stream habitats summarized within local and network stream catchments as well as 90 m local and network buffer of stream reaches throughout the conterminous U.S. The source datasets compiled and attributed to spatial units were identified as being: (1) meaningful for assessing fluvial fish habitat; (2) consistent across the entire study area in the way that they were assembled; (3) broadly representative of conditions in the past 10 years, and (4) of sufficient spatial resolution that they could be used to make valid comparisons among local catchment units. Variables summarized at the catchment scale include measures of anthropogenic...
Categories: Data;
Types: Citation;
Tags: Alabama,
Anthropogenic factors,
Arizona,
Arkansas,
California,
The Regional Estuary Assessment for the northern Gulf of Mexico represents an effort to develop, test, and implement a new assessment methodology for marine habitats that improves the analytical basis for identifying impacts to estuary fish habitats. Building from work completed for the National Estuary Assessment, this approach includes: 1) information on fish and shellfish presence/absence from over 70,000 sampling events collected over two decades, to better relate fish habitat condition to natural and anthropogenic variables; 2) data on natural factors, to better incorporate information on the natural susceptibility of individual estuaries; and 3) regional datasets not available on a nationally-consistent basis....
Categories: Data;
Types: ArcGIS REST Map Service,
Map Service;
Tags: 2015 National Assessment,
2015 National Assessment,
CONTINENT > NORTH AMERICA > UNITED STATES OF AMERICA > ALABAMA,
CONTINENT > NORTH AMERICA > UNITED STATES OF AMERICA > FLORIDA,
CONTINENT > NORTH AMERICA > UNITED STATES OF AMERICA > LOUISIANA,
This geodatabase contains 90 meter buffers of streams within the National Hydrography Dataset Plus Version 1 (NHDPlusV1). These buffers were developed by converting NHDPlusV1 flowlines to a 30m grid, then running a euclidean allocation function in ArcPy to generate buffer zones. For flowlines representing artificial paths within NHD area river polygons, buffers extend from the outside edges ("banks") of the polygon outward. The source code for buffer development can be found at https://github.com/ArthurCooper/NFHP-Buffer-Code.
Types: Citation;
Tags: 2015 National Assessment,
2015 National Assessment,
Alabama,
Arizona,
Arkansas,
This geodatabase contains information on brook trout occupancy in the southern portion of the brook trout range (PA and south). Fish sample data from a number of state and federal agencies/organizations were used to define patches for brook trout as groups of occupied contiguous catchment polygons from the National Hydrography Dataset Plus Version 1 (NHDPlusV1) catchment GIS layer. After defining patches, NHDPlusV1 catchments were assigned occupancy codes. Then state and federal agencies reviewed patches and codes to verify data accuracy. A similar effort is currently being conducted by the Eastern Brook Trout Joint Venture to develop occupancy data for the remainder of the brook trout range including states of...
Categories: Data;
Types: ArcGIS REST Map Service,
ArcGIS Service Definition,
Downloadable,
Map Service;
Tags: Biological Data,
EBTJV,
FHP Product,
Georgia,
Habitat Characterization,
The U.S. Geological Survey, in cooperation with the Reservoir Fisheries Habitat Partnership, combined multiple national databases for the purpose of calculating new morphological metrics for 3,828 reservoirs over 250 acres in surface area. These new metrics include, but are not limited to, shoreline development index, index of basin permanence, development of volume and other descriptive metrics based on established morphometric formulas. The new database also contains modeled chemical metrics from the SPARROW model and physical metrics such as surface area, storage, hydraulic height, etc. Because of the nature of the existing databases used to compile the Reservoir Morphology Database the inherent missing data,...
Categories: Data;
Tags: Conterminous United States,
FHP Product,
Habitat Characterization,
Hydrogeology,
Lentic,
This spatial data layer provides an indirect estimate of emergent, scrub-shrub and forested tidal wetland losses for 55 non-lagoonal estuaries spanning the contiguous United States West Coast. Losses are defined as those areas that were tidal wetlands prior to European settlement, but are no longer tidal wetlands today. Losses were estimated by comparing the National Wetland Inventory‘s mapping of current tidal wetlands to the Pacific Marine and Estuarine Fish Habitat Partnership (PMEP)’s West Coast Estuary Extent mapping. The estuary extent layer represents the likely historical extent of tidal wetlands, so areas not identified as current tidal wetlands in the National Wetlands Inventory (NWI) are considered...
Categories: Data;
Types: ArcGIS REST Map Service,
Map Service;
Tags: FHP Product,
Habitat Characterization,
Marine,
National Assessment,
PMEP,
Conservation rank data for each drainage catchments in the Upper Colorado River Basin. Some smaller catchments were not ranked. Catchments are the drainage area (local watersheds) for each individual stream segment within the 1:100,000 scale National Hydrography Plus Version 1 (NHDPlusV1) dataset. The NHDplus catchments have been ranked (valued) based on the representation of native fish species given the threats to their persistence (i.e., non-native fish species, land use, and habitat fragmentation). The ranking process placed importance on areas with several native species as well as areas important to individual species with restricted distributions and so is not simply a species “hot spot” assessment. Catchments...
Categories: Data;
Types: ArcGIS REST Map Service,
ArcGIS Service Definition,
Downloadable,
Map Service;
Tags: DFHP,
FHP Product,
Habitat Characterization,
NFHP Cooperator,
NHDPlusV1,
This map viewer highlights spatial data products developed by PMEP to characterize habitats and synthesize information in support of habitat conservation and restoration goal setting. Most of the data presented in this viewer are available at https://www.pacificfishhabitat.org/data.
|

|
