Filters: Tags: Habitat fragmentation (X)
47 results (39ms)|
Filters
Date Range
Extensions Types Contacts
Categories Tag Types
|
This raster dataset quantifies the structural sagebrush connectivity in the sagebrush biome at 270-meter resolution. Connectivity was calculated using an omnidirectional circuit-based algorithm, with sources, targets, and conductance based on sagebrush fractional component from the RCMAP sagebrush products for 1985, 1990, 1995, 2000, 2005, 2010, 2015, and 2020. Cumulative current density was used to represent connectivity and binned into 20 quantile-based classes.
These data are CSV files comprised of a heading and tables from Appendix 1 and Appendix 2 in the accompanying paper. The tables show the sampling dates and locations for the coachwhip (Masticophis flagellum) and striped racer (Masticophis lateralis) in pit-fall arrays (Fisher et al. 2008) monitored in southern California from 1995-2000. GPS data are shown in decimal degrees and were collected in the field using the WGS84 datum system. Elevation is in meters. Columns in the tables include a site ID number assigned to each site name, the year and calendar dates each site was sampled, number of arrays, number of sampling days, number of sampling occasions, and whether or not each of the target species were detected...
This dataset represents results from this study attributed to the NHDPlus stream reach segments. Human impacts occurring throughout the Northeast and Midwest United States, including urbanization, agriculture, and dams, have multiple effects on the region’s streams which support economically valuable stream fishes. Changes in climate are expected to lead to additional impacts in stream habitats and fish assemblages in multiple ways, including changing stream water temperatures. To manage streams for current impacts and future changes, managers need region-wide information for decision-making and developing proactive management strategies. Our project met that need by integrating results of a current condition...
Categories: Data;
Types: Citation,
Downloadable,
Map Service,
OGC WFS Layer,
OGC WMS Layer,
Shapefile;
Tags: Aquatic habitats,
Connecticut,
Data Visualization & Tools,
Delaware,
Fish,
This file contains results from the project "Assessing climate-sensitive ecosystems in the southeastern U.S.", funded by the Department of Interior's Southeast Climate Science Center. Metrics fitting the categories of sensitivity, exposure, and adaptive capacity were calculated for twelve ecosystems in the southeastern U.S. and the Caribbean. Metrics include historic temperature and precipitation, projected future climate variables under two emissions scenarios, projected area affected by sea-level rise, proportion of each under protected status, distance from developed areas, variation in elevation, and human modification.
This dataset contains single nucleotide polymorphism (SNP) information for aquatic insect species collected in tributaries of the Colorado River in Grand Canyon (Arizona, USA), as well as SNP information for individuals collected from reference reaches of the Upper Colorado River Basin in Utah. This dataset focuses specifically on three species that were common and widely distributed throughout tributary streams in Grand Canyon: a mayfly (Fallceon quilleri), a caddisfly (Hydrospyche oslari), and a water strider (Rhagovelia distincta).
This dataset is the second installment of a yearly connectivity update for forested habitat within the Great Lakes Restoration Initiative's (GLRI) Terrestrial Habitats & Connectivity (TH&C) work group's Pilot Area. The Pilot Area is a region of the northern Great Lakes Basin between Ashland, WI and the Keweenaw Peninsula and is bounded by Lake Superior in the north and the basin boundary in the south, including a 70 km buffer. Each year the TH&C selects project proposals for funding within the pilot area. These proposals involve either restoration, research, or land acquisition aimed at improving or increasing forest connectivity in this area. The intended purpose of each year’s update is to understand the effects...
This dataset is the second installment of a yearly connectivity update for open habitat within the Great Lakes Restoration Initiative's (GLRI) Terrestrial Habitats & Connectivity (TH&C) work group's Pilot Area. The Pilot Area is a region of the northern Great Lakes Basin between Ashland, WI and the Keweenaw Peninsula and is bounded by Lake Superior in the north and the basin boundary in the south, including a 70 km buffer. Each year the TH&C selects project proposals for funding within the pilot area. These proposals involve either restoration, research, or land acquisition aimed at improving or increasing open connectivity in this area. The intended purpose of each year’s update is to understand the effects of...
This dataset maps the connectivity and bottlenecks among protected areas within a six km ribbon along the terrestrial coastline of the U.S. Great Lakes. Each pixel represents the relative contribution that cell provides to connectivity between and among the protected areas. When aggregated the pixel values produce a map of all possible pathways between protected areas, providing the end user with an understanding of each pathway's potential to facilitate or impede species movement. The relative contribution values are determined using the National Land Cover Dataset, where each land use pixel is converted into a value representing its resistance to movement. That is, how easy or difficult movement through that land...
We used land cover projections for 2011 and 2050 of two scenarios derived from the Intergovernmental Panel on Climate Change (IPCC) Special Report on Emission Scenarios (SRES). Scenario A1B emphasizes economic growth with a global orientation and scenario B2 focuses on environmental sustainability with a regional view. Our study area included counties within the southern Great Plains ecoregion in Oklahoma, Texas, and New Mexico. We calculated changes in landscape connectivity (dECA) between 2011 and 2050 for different species groups and landscape scenarios. We also calculated changes in habitat suitability (dA). We assessed the degree to which changes in landscape connectivity were influenced by changes in grassland...
Categories: Data;
Types: Downloadable,
Map Service,
OGC WFS Layer,
OGC WMS Layer,
Shapefile;
Tags: Forests,
Grasslands and Plains,
Landscapes,
Other Wildlife,
South Central CASC,
Conclusions: Emigration rates are closely tied to edge structure. Low contrast edges promote edge permeability Thresholds/Learnings: Synopsis: The behavior of two butterfly species, one habitat specialist and one habitat generalist, were tracked at four prairie edges to determine the extent to which edge structure affects emigration. The specialist species responded strongly to all edges, and was particularly affected by edge density. The generalist species responded strongly only to high contrast edges. Emigration rates are closely tied to edge structure. Therefore, promoting low contrast edges in conservation planning may positively influence edge permeability and species richness in highly fragmented landscapes.
Categories: Publication;
Types: Citation,
Map Service,
OGC WFS Layer,
OGC WMS Layer,
OGC WMS Service;
Tags: Iowa,
Land use configuration,
Landscape fragmentation,
Lepidoptera,
butterflies,
Synopsis: A simulation model, modified from percolation theory, was empirically tested to determine if population distribution patterns correlated with different landscape patterns, for different species across a landscape. Using two grasshopper species in a short-grass prairie of north-central Colorado, the experiment found that the threshold for population aggregation (random to clumped distribution) was differentially affected by dispersal ranges and habitat specialization for habitat generalists and habitat specialists, respectively. Habitat generalists aggregated differentially depending on dispersal abilities. Generalist species with good dispersal abilities aggregated when <35% of the landscape consisted...
Categories: Publication;
Types: Citation,
Map Service,
OGC WFS Layer,
OGC WMS Layer,
OGC WMS Service;
Tags: Colorado,
Landscape fragmentation,
Natural cover amount,
Percolation theory,
Population distribution,
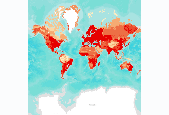
Magnitude of habitat fragmentation indicated by largest patch size, by terrestrial ecoregion. We considered agriculture, urban infrastructure, roads, and railroads as “fragmenting” features to the landscape and areas not converted to agriculture, urban infrastructure, roads, or railroads as “nonfragmented” terrestrial landscape patches. We used input spatial data from JRC’s GLC 2000 (2003), CIESIN et al. (2004), Defense Mapping Agency (1992), and South American Conservation Region (2005). To produce the data, we constructed a global map grid of fragmenting features (Mollweide projection, based on the WGS 1984 datum; 1 km2 resolution); this grid was then combined with the GLC 2000, adding a new “fragmenting features”...
Landscape-level variables operating at multiple spatial scales likely influence wetland amphibian assemblages but have not been investigated in detail. We examined the significance of habitat loss and fragmentation, as well as selected within-wetland conditions, affecting amphibian assemblages in twentyone glacial marshes. Wetlands were located within ttrban and agricultural regions of central and southwestern Minnesota, USA and were distributed across two ccoregions: tallgrass prairie and northern hardwood forest. We surveyed amphibian assemblages and used a geographic information system to quantify land-use variables at lhree scales: 500, 1000, and 2500 m. Ten species of amphibians were detected, the most abundant...
Categories: Publication;
Types: Citation,
Journal Citation;
Tags: Minnesota,
Wetlands,
amphibians,
habitat fragmentation,
landscape ecology,
We evaluated the fragmentation of the western United States by anthropogenic features. The addition of roads, railroads, and power lines to wildlands, and the conversion of wildlands to agricultural land and/or urban areas, induces fragmentation. We used the following spatial data sets to model anthropogenic fragmentation: agricultural land, populated areas, power lines, railroads, and roads. Because we were interested in the spatial arrangements of wildland patches and how anthropogenic fragmentation affects wildlife dispersal, we buffered some of these spatial data sets according to their area of influence. For example, the area of influence of interstate highways extends beyond the traffic lanes (Rowland et al....
Categories: Data;
Types: Downloadable,
GeoTIFF,
Map Service,
Raster;
Tags: Arizona,
California,
Colorado,
Idaho,
Montana,
Conclusions: Marten capture rates were negatively correlated with increasing proximity of open areas and increasing extent of high-contrast edges. Forested landscapes were unsuitable for martens when the average nearest-neighbor distance between open, non-forested patches was <100m. Thresholds/Learnings: Synopsis: This study aimed to determine whether American marten abundance changed with incremental increases in habitat fragmentation caused by the combined effects of natural openings and timber clearcuts. Researchers evaluated differences in marten capture rates in 18 study sites with different levels of fragmentation. Martens appeared to respond negatively to low levels of habitat fragmentation, even with remaining...
Categories: Publication;
Types: Citation,
Map Service,
OGC WFS Layer,
OGC WMS Layer,
OGC WMS Service;
Tags: American martens,
Land use configuration,
Landscape fragmentation,
Natural cover amount,
Utah,
This dataset maps the connectivity and bottlenecks among habitat patches within a six-kilometer ribbon along the United States terrestrial coastline of the Great Lakes. Each pixel represents the relative value that cell contributes to connectivity between and among habitat patches. When aggregated the pixel values produce a map of all possible pathways between habitat patches providing the end user with an understanding of each pathways potential to facilitate or impede species movement. The relative contribution values are determined using the National Land Cover Dataset, where each land use pixel is converted into a value representing its resistance to movement. That is, how easily or difficult movement through...
This GeoJSON dataset contains information about 10780 waterfall and 1080 rapid locations (referred to as falls throughout the metadata) and characteristics (e.g. type and height) for the conterminous United States. This dataset centralizes known information about falls while providing basic quality control (i.e. resolving duplicate records and spatial accuracy checks) and linkages to stream networks intended to facilitate stream network analyses. Locations of falls were sourced from the World Waterfall Database (WWD, www.worldwaterfalldatabase.com), the US Forest Service Center for Aquatic Technology Transfer (acquired from Southeast Aquatic Barrier Inventory), and Geographic Names Information System (GNIS, https://geonames.usgs.gov)....
A new and more complete version of this dataset can be found at https://doi.org/10.5066/P9QQTKA0. This dataset contains information about waterfall location and characteristics. It also provides a linear reference to two National Hydrography Datasets. This dataset is based off the World Waterfall Database (WWD) and other source datasets. The coordinates and spatial attributes from the WWD were used to help verify locations in Google Earth. From there, the USGS HydroLink Tool was used to link data to both the NHDPlusV2.1 (1:100,000 scale) and NHD High Resolution Dataset (1:24,000 scale). This dataset currently includes waterfalls from the states of Indiana, Wisconsin, Michigan, Nebraska, Illinois and Missouri....
Categories: Data;
Types: Citation,
Downloadable,
Map Service,
OGC WFS Layer,
OGC WMS Layer,
Shapefile;
Tags: Connectivity,
Habitat fragmentation,
Hydro linked data,
Hydrographically linked data,
Hydrologically linked data,
This dataset contains information about waterfall locations and estimated waterfall heights on five of the main Hawaiian Islands including Kauai, Oahu, Maui, Molokai, and Hawaii. Initial spatial information was gathered from the National Hydrography Dataset (NHD), Geographic Names Information System (GNIS), the Hawaii Statewide GIS Program, and the World Waterfall Database. Where image quality permitted, the coordinates and spatial attributes from source data were used to verify and improve the quality of waterfall locations using Google Earth Pro (Google Inc. 2017)and the USGS HydroLink Tool. The HydroLink Tool was also used to link data to both the NHDPlusV2.1 and NHD High Resolution datasets by adding NHD addressing...
Human impacts occurring throughout the Northeast and Midwest United States, including urbanization, agriculture, and dams, have multiple effects on the region’s streams which support economically valuable stream fishes. Changes in climate are expected to lead to additional impacts in stream habitats and fish assemblages in multiple ways, including changing stream water temperatures. To manage streams for current impacts and future changes, managers need region-wide information for decision-making and developing proactive management strategies. Our project met that need by integrating results of a current condition assessment of stream habitats based on fish response to human land use, water quality impairment,...
Categories: Data;
Types: Citation;
Tags: Aquatic Biology,
Aquatic habitats,
Connecticut,
Data Visualization & Tools,
Delaware,
|

|
