Filters: Tags: Hanksville (X)
11 results (45ms)|
Filters
Date Range
Types Contacts
Tag Types Tag Schemes |
The dataset describes rangeland monitoring results from the Hanksville, UT (USA) area. Monitoring results consist of canopy cover of plant species and functional types according to ecological site group from 1967 to 2013. The study area is bordered on the north by the Wayne-Emery County line, on the west by Capitol Reef National Park, and on the south and east by the Colorado River, Glen Canyon National Recreation Area, and Canyonlands National Park. Cover was estimated every 1 to 5 years (except the last measurement that had a 12 year interval) from 1967 to 2013 at 36 permanently marked sites in 15 livestock grazing allotments/pastures. Canopy cover of perennial plant species was estimated to the nearest tenth...
Types: Citation;
Tags: Climate change,
Colorado Plateau,
Ecological sites,
Garfield County,
Grazing,
This data set contains imagery from the National Agriculture Imagery Program (NAIP). The NAIP program is administered by USDA FSA and has been established to support two main FSA strategic goals centered on agricultural production. These are, increase stewardship of America's natural resources while enhancing the environment, and to ensure commodities are procured and distributed effectively and efficiently to increase food security. The NAIP program supports these goals by acquiring and providing ortho imagery that has been collected during the agricultural growing season in the U.S. The NAIP ortho imagery is tailored to meet FSA requirements and is a fundamental tool used to support FSA farm and conservation programs....
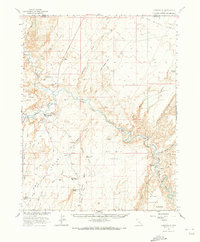
USGS Historical Quadrangle in GeoPDF.
This data set contains imagery from the National Agriculture Imagery Program (NAIP). The NAIP program is administered by USDA FSA and has been established to support two main FSA strategic goals centered on agricultural production. These are, increase stewardship of America's natural resources while enhancing the environment, and to ensure commodities are procured and distributed effectively and efficiently to increase food security. The NAIP program supports these goals by acquiring and providing ortho imagery that has been collected during the agricultural growing season in the U.S. The NAIP ortho imagery is tailored to meet FSA requirements and is a fundamental tool used to support FSA farm and conservation programs....
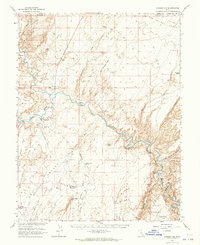
USGS Historical Quadrangle in GeoPDF.
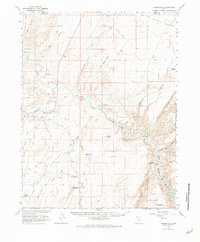
USGS Historical Quadrangle in GeoPDF.
This data set contains imagery from the National Agriculture Imagery Program (NAIP). The NAIP program is administered by USDA FSA and has been established to support two main FSA strategic goals centered on agricultural production. These are, increase stewardship of America's natural resources while enhancing the environment, and to ensure commodities are procured and distributed effectively and efficiently to increase food security. The NAIP program supports these goals by acquiring and providing ortho imagery that has been collected during the agricultural growing season in the U.S. The NAIP ortho imagery is tailored to meet FSA requirements and is a fundamental tool used to support FSA farm and conservation programs....
This data set contains imagery from the National Agriculture Imagery Program (NAIP). The NAIP program is administered by USDA FSA and has been established to support two main FSA strategic goals centered on agricultural production. These are, increase stewardship of America's natural resources while enhancing the environment, and to ensure commodities are procured and distributed effectively and efficiently to increase food security. The NAIP program supports these goals by acquiring and providing ortho imagery that has been collected during the agricultural growing season in the U.S. The NAIP ortho imagery is tailored to meet FSA requirements and is a fundamental tool used to support FSA farm and conservation programs....
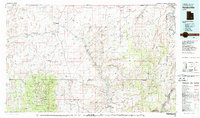
USGS Historical Quadrangle in GeoPDF.
USGS Historical Quadrangle in GeoPDF.
USGS Historical Quadrangle in GeoPDF.
|

|
