Filters: Tags: Harris County (X)
302 results (59ms)|
Filters
Date Range
Extensions Types Contacts
Categories Tag Types
|
This dataset documents the depth to groundwater measured in wells screened in the Chicot, Evangeline, and Jasper aquifers in the Houston‐Galveston region, Texas for 2019. The U.S. Geological Survey prepared this dataset in cooperation with the Harris‐Galveston Subsidence District, City of Houston, Fort Bend Subsidence District, Lone Star Groundwater Conservation District, and Brazoria County Groundwater Conservation District. This dataset was created to provide resource managers, public officials, researchers, and the general public with ready access to information regarding depths to groundwater in the region. All of the data in this dataset were collected from December 2018 through March 2019 and are stored in...
USGS Topo Map Vector Data (Vector) 29140 Midland, Georgia 20200914 for 7.5 x 7.5 minute FileGDB 10.1
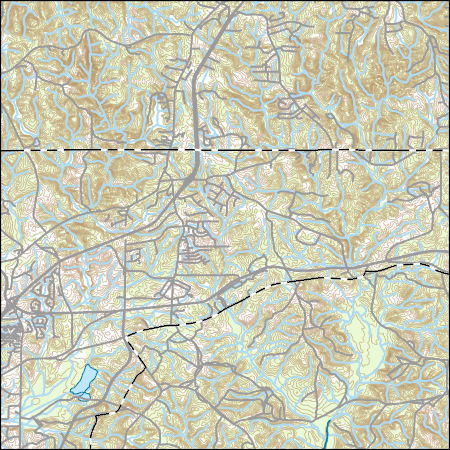
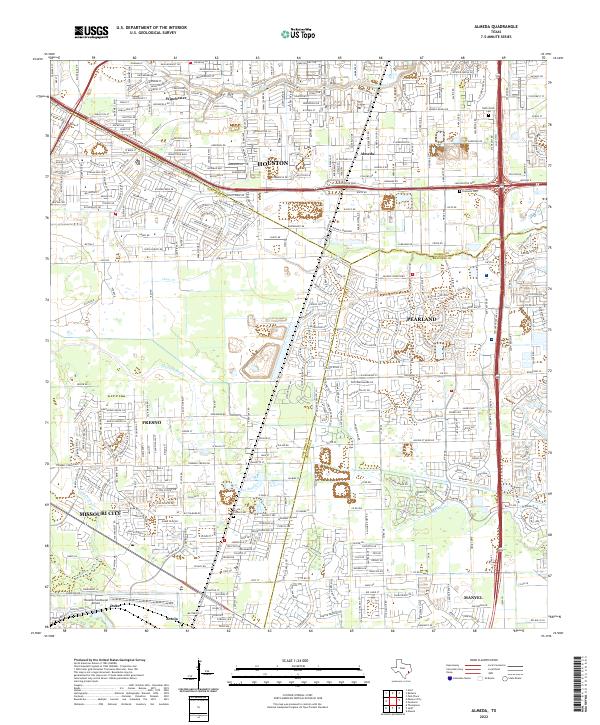
Layers of geospatial data include contours, boundaries, land cover, hydrography, roads, transportation, geographic names, structures, and other selected map features.
Layers of geospatial data include contours, boundaries, land cover, hydrography, roads, transportation, geographic names, structures, and other selected map features.
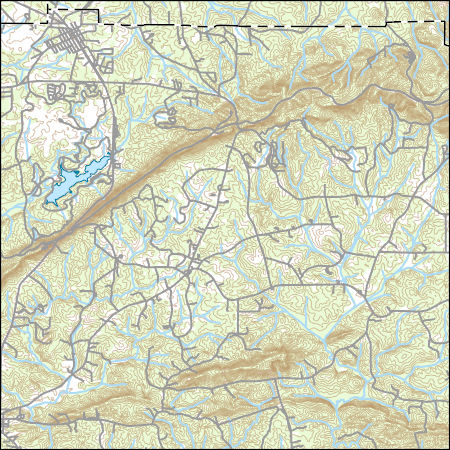
Layers of geospatial data include contours, boundaries, land cover, hydrography, roads, transportation, geographic names, structures, and other selected map features.
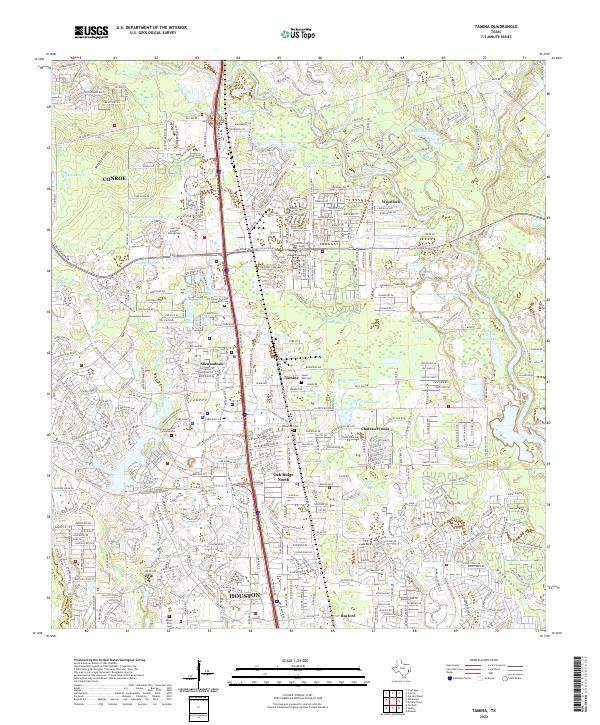
Layered geospatial PDF 7.5 Minute Quadrangle Map. Layers of geospatial data include orthoimagery, roads, grids, geographic names, elevation contours, hydrography, and other selected map features. This map is derived from GIS (geospatial information system) data. It represents a repackaging of GIS data in traditional map form, not creation of new information. The geospatial data in this map are from selected National Map data holdings and other government sources.
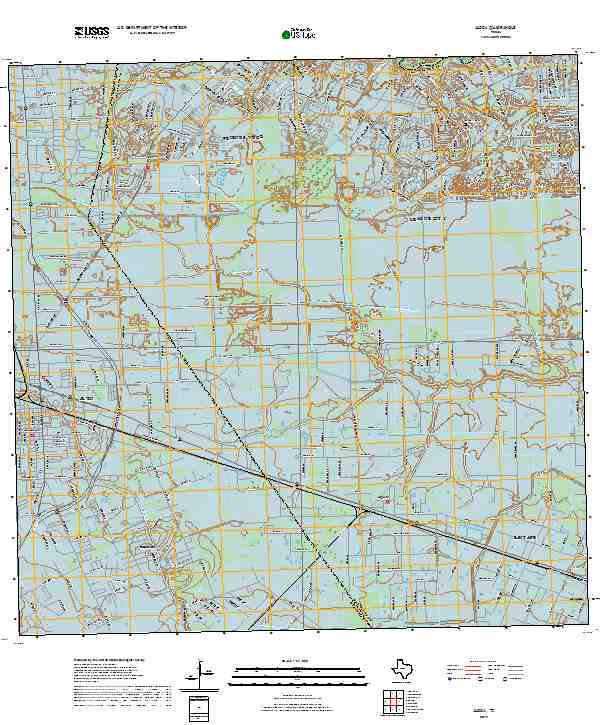
Layered geospatial PDF 7.5 Minute Quadrangle Map. Layers of geospatial data include orthoimagery, roads, grids, geographic names, elevation contours, hydrography, and other selected map features. This map is derived from GIS (geospatial information system) data. It represents a repackaging of GIS data in traditional map form, not creation of new information. The geospatial data in this map are from selected National Map data holdings and other government sources.
Layered geospatial PDF 7.5 Minute Quadrangle Map. Layers of geospatial data include orthoimagery, roads, grids, geographic names, elevation contours, hydrography, and other selected map features. This map is derived from GIS (geospatial information system) data. It represents a repackaging of GIS data in traditional map form, not creation of new information. The geospatial data in this map are from selected National Map data holdings and other government sources.
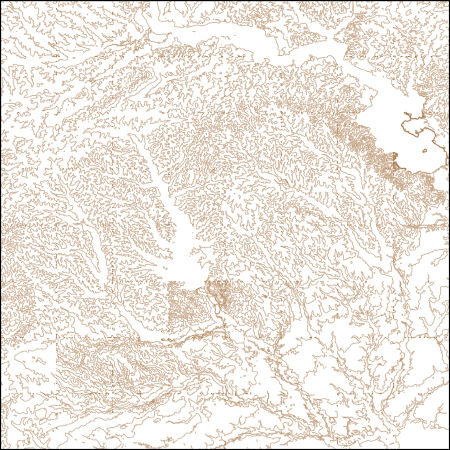
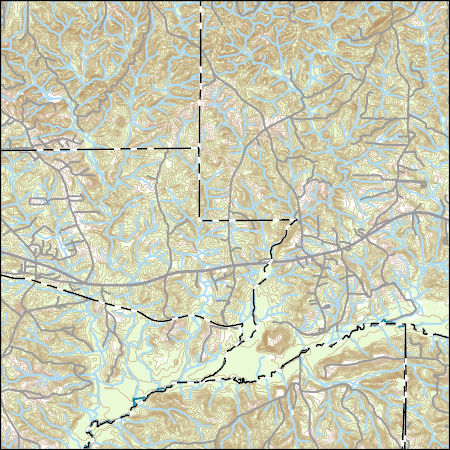
These vector contour lines are derived from the 3D Elevation Program using automated and semi-automated processes. They were created to support 1:24,000-scale CONUS and Hawaii, 1:25,000-scale Alaska, and 1:20,000-scale Puerto Rico / US Virgin Island topographic map products, but are also published in this GIS vector format. Contour intervals are assigned by 7.5-minute quadrangle, so this vector dataset is not visually seamless across quadrangle boundaries. The vector lines have elevation attributes (in feet above mean sea level on NAVD88), but this dataset does not carry line symbols or annotation.
Layers of geospatial data include contours, boundaries, land cover, hydrography, roads, transportation, geographic names, structures, and other selected map features.
Types: Citation;
Tags: 7.5 x 7.5 minute,
7_5_Min,
Brazoria County,
Combined Vector,
Combined Vector,
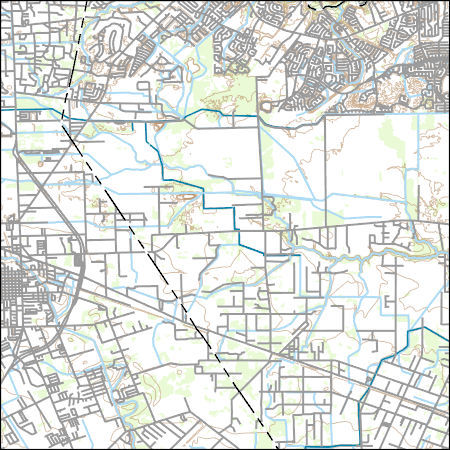
Layers of geospatial data include contours, boundaries, land cover, hydrography, roads, transportation, geographic names, structures, and other selected map features.
Layers of geospatial data include contours, boundaries, land cover, hydrography, roads, transportation, geographic names, structures, and other selected map features.
Types: Citation;
Tags: 7.5 x 7.5 minute,
7_5_Min,
Combined Vector,
Combined Vector,
Combined Vector,
Layers of geospatial data include contours, boundaries, land cover, hydrography, roads, transportation, geographic names, structures, and other selected map features.
Types: Citation;
Tags: 7.5 x 7.5 minute,
7_5_Min,
Combined Vector,
Combined Vector,
Combined Vector,
Layers of geospatial data include contours, boundaries, land cover, hydrography, roads, transportation, geographic names, structures, and other selected map features.
Types: Citation;
Tags: 7.5 x 7.5 minute,
7_5_Min,
Combined Vector,
Combined Vector,
Combined Vector,
The U.S. Geological Survey in cooperation with the Harris‐Galveston Subsidence District, City of Houston, Fort Bend Subsidence District, and Lone Star Groundwater Conservation District has produced this dataset of water‐level altitudes and water‐level altitude changes in the Chicot, Evangeline, and Jasper aquifers in the Houston‐Galveston region, Texas. This dataset shows current‐year (2017) water‐level altitudes for each aquifer, 5‐year (2012‐17) water‐level changes for each aquifer, long‐term (1990‐2017 and 1977‐2017) water‐level changes for the Chicot and Evangeline aquifers, and long‐term (2000‐2017) water‐level change for the Jasper aquifer. The water‐level measurements from which the dataset were built are...
Layers of geospatial data include contours, boundaries, land cover, hydrography, roads, transportation, geographic names, structures, and other selected map features.
Layers of geospatial data include contours, boundaries, land cover, hydrography, roads, transportation, geographic names, structures, and other selected map features.
Layers of geospatial data include contours, boundaries, land cover, hydrography, roads, transportation, geographic names, structures, and other selected map features.
Types: Citation;
Tags: 7.5 x 7.5 minute,
7_5_Min,
Brazoria County,
Combined Vector,
Combined Vector,
Layers of geospatial data include contours, boundaries, land cover, hydrography, roads, transportation, geographic names, structures, and other selected map features.
Types: Citation;
Tags: 7.5 x 7.5 minute,
7_5_Min,
Brazoria County,
Combined Vector,
Combined Vector,

These vector contour lines are derived from the 3D Elevation Program using automated and semi-automated processes. They were created to support 1:24,000-scale CONUS and Hawaii, 1:25,000-scale Alaska, and 1:20,000-scale Puerto Rico / US Virgin Island topographic map products, but are also published in this GIS vector format. Contour intervals are assigned by 7.5-minute quadrangle, so this vector dataset is not visually seamless across quadrangle boundaries. The vector lines have elevation attributes (in feet above mean sea level on NAVD88), but this dataset does not carry line symbols or annotation.
Layers of geospatial data include contours, boundaries, land cover, hydrography, roads, transportation, geographic names, structures, and other selected map features.
|

|
