Filters: Tags: Hurricane Sandy (X)
38 results (17ms)|
Filters
Date Range
Extensions Types
Contacts
Categories Tag Types Tag Schemes |
High-water marks were collected following Hurricane Sandy, October 29-30, 2012, along the coastal areas of Connecticut, Rhode Island, and Massachusetts. Information on 371 high-water marks that were flagged following Hurricane Sandy is presented in this data release. The general information on the high-water marks presented includes site identification number, location, elevation, quality, type, and website links to the data. Of the 371 high-water marks flagged, 364 high-water marks were surveyed and 7 high-water marks were not found. The U.S. Geological Survey identified and flagged the high-water marks during October and November 2012 following Hurricane Sandy; and surveyed the marks during October and November...
Categories: Data;
Tags: Connecticut,
Hurricane Sandy,
Massachusetts,
Rhode Island,
USGS Science Data Catalog (SDC),
In 2012, Hurricane Sandy struck the Northeastern US causing devastation among coastal ecosystems. Post-hurricane marsh restoration efforts have included sediment deposition, planting of vegetation, and restoring tidal hydrology. The work presented here is part of a larger project funded by the National Fish and Wildlife Foundation (NFWF) to monitor the post-restoration ecological resilience of coastal ecosystems in the wake of Hurricane Sandy. The U.S. Geological Survey Woods Hole Coastal and Marine Science Center made in-situ observations during 2018-2019 and 2022-2023 at two sites: Thompsons Beach, NJ and Stone Harbor, NJ. Marsh creek hydrodynamics and water quality including currents, waves, water levels, water...
Categories: Data;
Types: Downloadable,
Map Service,
OGC WFS Layer,
OGC WMS Layer,
Shapefile;
Tags: Atlantic,
Hurricane Sandy,
National Fish and Wildlife Foundation,
New Jersey,
Stone Harbor,
In 2012, Hurricane Sandy struck the Northeastern US causing devastation among coastal ecosystems. Post-hurricane marsh restoration efforts have included sediment deposition, planting of vegetation, and restoring tidal hydrology. The work presented here is part of a larger project funded by the National Fish and Wildlife Foundation (NFWF) to monitor the post-restoration ecological resilience of coastal ecosystems in the wake of Hurricane Sandy. The U.S. Geological Survey Woods Hole Coastal and Marine Science Center made in-situ observations during 2018-2019 and 2022-2023 at two sites: Thompsons Beach, NJ and Stone Harbor, NJ. Marsh creek hydrodynamics and water quality including currents, waves, water levels, water...
This dataset represents a species distribution model for least tern (Sternula antillarum) on New Jersey’s Atlantic coast and was created as part of the Protection of Critical Beach Habitat project. In addition to least tern, this project includes species distribution models for piping plover (Charadrius melodus), least tern (Sternula antillarum), and American oystercatcher (Haematopus palliatus). All species models can be found in the Data Basin gallery Protection of Critical Beach-nesting Bird Habitats in the Wake of Severe Coastal Storms.Species distribution modeling was conducted to examine the influence of landscape scale variables and beach management strategies on bird breeding habitat suitability. The probability...
Categories: Data;
Types: ArcGIS REST Map Service,
ArcGIS Service Definition,
Downloadable,
Map Service,
OGC WFS Layer,
OGC WMS Layer,
OGC WMS Service;
Tags: Coastal,
Data,
Haematopus palliatus,
Hurricane Sandy,
Hurricane Sandy,
In the face of sea level rise and as climate change conditions increase the frequency and intensity of tropical storms along the north-Atlantic Coast, coastal areas will become increasingly vulnerable to storm damage, and the decline of already-threatened species could be exacerbated. Predictions about response of coastal birds to effects of hurricanes will be essential for anticipating and countering environmental impacts. This project will assess coastal bird populations, behavior, and nesting in Hurricane Sandy-impacted North Carolina barrier islands. The project comprises three components: 1) ground-based and airborne lidar analyses to examine site specific selection criteria of coastal birds; 2) NWI classification...
Categories: Data;
Types: Citation,
Downloadable,
Map Service,
OGC WFS Layer,
OGC WMS Layer,
Shapefile;
Tags: Cape Hatteras,
Cape Lookout,
Hurricane Sandy,
North Carolina,
Outer Banks,
Recommended citation:Rice, T.M. 2017. Inventory of Habitat Modifications to Sandy Oceanfront Beaches in the U.S. Atlantic Coast Breeding Range of the Piping Plover (Charadrius melodus) as of 2015: Maine to North Carolina. Report submitted to the U.S. Fish and Wildlife Service, Hadley, Massachusetts. 295 p.This report describes a project that inventoried modifications to both tidal inlet and sandy, oceanfront beach habitats along the Atlantic coast from Maine through North Carolina. Three distinct time periods were assessed: before Hurricane Sandy (early 2012), immediately after Hurricane Sandy (November 2012), and three years after Hurricane Sandy (2015) to document modifications to sandy beaches and tidal inlet...
This project is a collaborative effort to assess risks and set response priorities for tidal-marsh dependent bird species from Virginia to maritime Canada.With more than 1,500 sampling sites for estimating bird abundance and plant community composition, 22 sampling sites for estimating species fecundity and survival, and 651 sampling points for measuring salt marsh elevation, the Salt marsh Habitat and Avian Research Program is an unprecedented undertaking to characterize threats to tidal-marsh dependent bird species along the entire mid-Atlantic coastline.Originally initiated in 2011 by a team of scientists looking to align efforts towards understanding threats to salt marsh birds across the region SHARP had enough...
Categories: Data,
Project;
Tags: 2014,
Conservation Planning,
Datasets/Database,
FWS R5 SA Project,
Federal resource managers,
This project inventoried modifications to both tidal inlet and sandy, oceanfront beach habitats along the Atlantic coast from Maine through North Carolina. Three distinct time periods were assessed: before Hurricane Sandy (early 2012), immediately after Hurricane Sandy (November 2012), and three years after Hurricane Sandy (2015) to document modifications to sandy beaches and tidal inlet habitat in response to the stormy. The inventories and series of reports were generated using Google Earth imagery.
Categories: Data,
Project;
Tags: 2014,
Data Management and Integration,
Datasets/Database,
FWS R5 SA Project,
Federal resource managers,
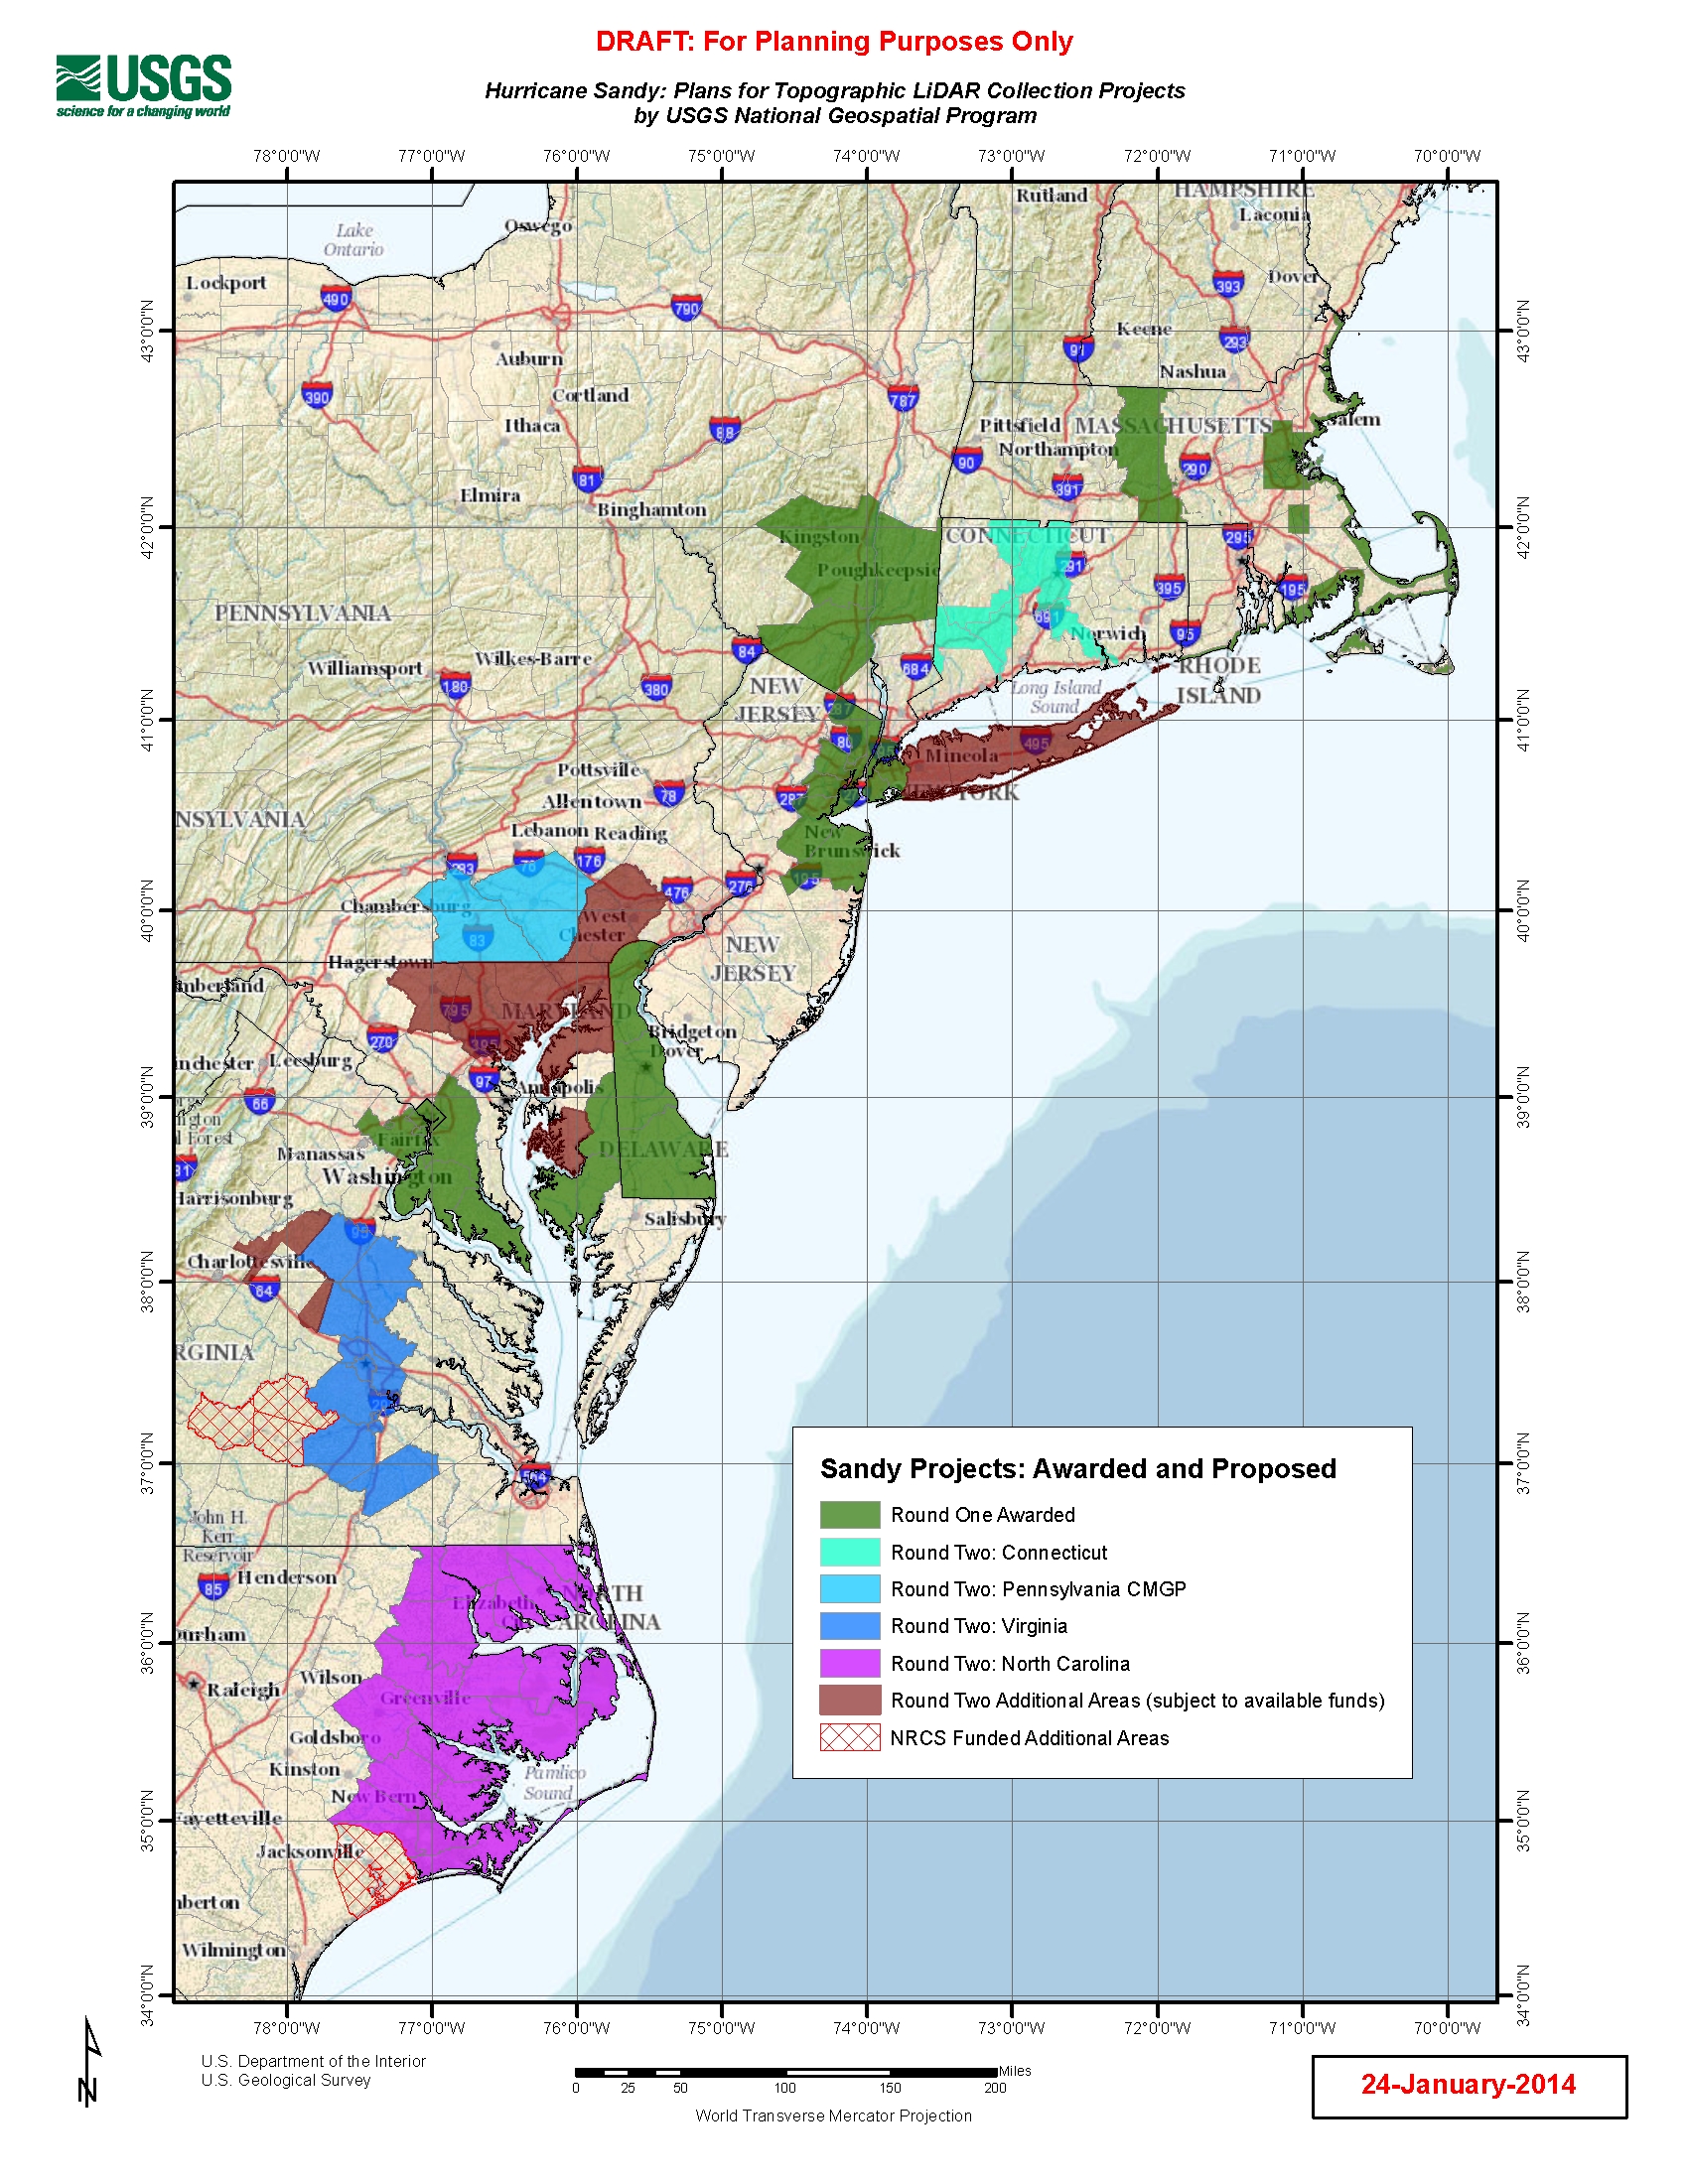
U.S. Geological Survey, Department of the Interior - The Hurricane Sandy Supplemental Funding lidar and DEM acquisition plan is part of the 3DEP initiative to systematically collect enhanced elevation data (Quality Level 2) in the form of high-quality light detection and ranging (lidar) data over the conterminous United States, Hawaii, and the territories on an 8-year schedule. The FY14 Hurricane Sandy acquisition plan currently anticipates collecting 20,000 - 30,000 sq. mi. within the impacted area. Exact area collected will depend on partnerships and other contributions to the plan. Interested parties who wish to become a funding partner with the USGS FY14 or in future years should contact a USGS Geospatial Liaison...
This project is being closely coordinated with a companion project funded by the North Atlantic LCC.In 2011, intense and sustained rain from Hurricane Irene and Tropical Storm Lee washed out roads throughout mountains of New York and New England as culverts running under those roads were not designed to handle such enormous volumes of water. Additional flooding from Hurricane Sandy, which lashed the Northeast coast and adjacent inland areas in October 2012, caused additional damage. The widespread effects of these massive storms underscore the need for a regional science-based approach to prioritize and increase the resiliency of roads to floods.Improving the resiliency of roads has multiple benefits beyond protecting...
Categories: Data,
Project;
Tags: 2014,
Applications and Tools,
Conservation Design,
FWS R5 SA Project,
Federal resource managers,
Rutgers University and Conserve Wildlife Foundation of New Jersey have partnered on a project entitled Protection of Critical Beach-nesting Bird Habitats in the Wake of Severe Coastal Storms under the North Atlantic LCC coordinated Hurricane Sandy Disaster Mitigation Funds beach resiliency projects. The project uses species’ distribution modeling to examine the landscape-scale habitat variables that influence beach-nesting bird habitat selection. The original project had the following primary goals: 1) catalogue suitable breeding habitat criteria for NJ’s beach-nesting birds; 2) quantify changes in beach-nesting bird habitat resulting from Superstorm Sandy; 3) evaluate the impact of anthropogenic storm recovery...
Categories: Data,
Project;
Tags: 2014,
Applications and Tools,
Conservation Planning,
FWS R5 SA Project,
Federal resource managers,
This dataset represents salt marsh communities in the Northeast Atlantic coast. The classification was produced using a combination of Digital Elevation Model (DEM) and National Agriculture Imagery Program (NAIP) multispectral imagery. This dataset combined with "Tidal Marsh Vegetation Classification, no DEM, 3m, Northeast U.S." provides a contiguous classification of tidal marsh cover types from coastal Maine to Virginia. The eight distinct cover/community types identified are: High marsh: Area flooded during spring tides related to the lunar cycle and dominated by Spartina patens, Distichlis spicata, Juncus gerardii, and short form Spartina alterniflora. Other species include Juncus roemerianus, Scirpus pungens,...
Categories: Data;
Types: ArcGIS REST Map Service,
ArcGIS Service Definition,
Downloadable,
Map Service;
Tags: coast,
hurricane sandy,
marsh,
salt,
sea level rise,
This dataset represents salt marsh communities in the Northeast Atlantic coast. The classification was produced using National Agriculture Imagery Program (NAIP) multispectral imagery for areas where no DEM was available to complete the full classification. This dataset combined with "Tidal Marsh Vegetation Classification, DEM, Northeast U.S." provides a contiguous classification of tidal marsh cover types from coastal Maine to Virginia. The six distinct cover/community types identified are: 1. High marsh: Area flooded during spring tides related to the lunar cycle and dominated by Spartina patens, Distichlis spicata, Juncus gerardii, and short form Spartina alterniflora. Other species include Juncus roemerianus,...
Categories: Data;
Types: ArcGIS REST Map Service,
ArcGIS Service Definition,
Downloadable,
Map Service;
Tags: coast,
hurricane sandy,
marsh,
salt,
sea level rise,
Coastal Hydrology and Storm Surge Storm-surge is one of the most powerful and destructive elements of major storm events. Excessively high tides associated with storms can flood and inundate coastal areas, often moving sediment and altering coastal landscapes and drainages. USGS provides critical expertise in measuring storm surge and assessing conditions both before and after the storm. Through development of storm tide monitoring networks, data analysis, and data delivery, USGS provides vital information to help coastal communities prepare for and recover from storm surge events. View Fact Sheet Science Science Support for Tribes Tide gage/weather station installed in collaboration with Mashpee-Wampanoag Tribe....
Categories: Data,
Project;
Types: Downloadable,
Map Service,
OGC WFS Layer,
OGC WMS Layer,
Shapefile;
Tags: Coastal Science,
Coastal Science,
Flood Inundation,
Flood Inundation,
Flood Inundation,
In 2012, Hurricane Sandy struck the Northeastern US causing devastation among coastal ecosystems. Post-hurricane marsh restoration efforts have included sediment deposition, planting of vegetation, and restoring tidal hydrology. The work presented here is part of a larger project funded by the National Fish and Wildlife Foundation (NFWF) to monitor the post-restoration ecological resilience of coastal ecosystems in the wake of Hurricane Sandy. The U.S. Geological Survey Woods Hole Coastal and Marine Science Center made in-situ observations during 2018-2019 and 2022-2023 at two sites: Thompsons Beach, NJ and Stone Harbor, NJ. Marsh creek hydrodynamics and water quality including currents, waves, water levels, water...
Categories: Data;
Tags: Atlantic,
Hurricane Sandy,
National Fish and Wildlife Foundation,
New Jersey,
Stone Harbor,
This community is established for communities that wish to use Data Entry for Project Tracking and Highlighting (DEPTH) web application. Communities must be added as a shortcut to the DEPTH Community in order to use the DEPTH interface.
Types: Map Service,
OGC WFS Layer,
OGC WMS Layer,
OGC WMS Service;
Tags: Hurricane Sandy,
Marcellus Shale,
NY,
New York,
StreamStats,
In 2012, Hurricane Sandy struck the Northeastern US causing devastation among coastal ecosystems. Post-hurricane marsh restoration efforts have included sediment deposition, planting of vegetation, and restoring tidal hydrology. The work presented here is part of a larger project funded by the National Fish and Wildlife Foundation (NFWF) to monitor the post-restoration ecological resilience of coastal ecosystems in the wake of Hurricane Sandy. The U.S. Geological Survey Woods Hole Coastal and Marine Science Center made in-situ observations during 2018-2019 and 2022-2023 at two sites: Thompsons Beach, NJ and Stone Harbor, NJ. Marsh creek hydrodynamics and water quality including currents, waves, water levels, water...
Categories: Data;
Types: Downloadable,
Map Service,
OGC WFS Layer,
OGC WMS Layer,
Shapefile;
Tags: Atlantic,
Hurricane Sandy,
National Fish and Wildlife Foundation,
New Jersey,
Stone Harbor,
This study combined a radar-based time series of Hurricane Sandy surge and estimated persistence with optical sensor-based marsh condition change to assess potential causal linkages of surge persistence and marsh condition change along the New Jersey Atlantic Ocean coast. Results based on processed TerraSAR-X and COSMO-SkyMed synthetic aperture radar (SAR) images indicated that surge flooding persisted for 12 h past landfall in marshes from Great Bay to Great Egg Harbor Bay and up to 59 h after landfall in many back-barrier lagoon marshes. Marsh condition change (i.e. loss of green marsh vegetation) was assessed from optical satellite images (Satellite Pour l’Observation de la Terre and Moderate Resolution Imaging...
Categories: Data;
Types: Citation,
Downloadable,
GeoTIFF,
Map Service,
Raster;
Tags: Hurricane Sandy,
New Jersey,
coincidence,
marsh condition,
surge persistence
This dataset represents a species distribution model for piping plover (Charadrius melodus) on New Jersey’s Atlantic coast and was created as part of the Protection of Critical Beach Habitat project. In addition to piping plover, this project includes species distribution models for piping plover (Charadrius melodus), least tern (Sternula antillarum), and American oystercatcher (Haematopus palliatus). All species models can be found in the Data Basin gallery Protection of Critical Beach-nesting Bird Habitats in the Wake of Severe Coastal Storms.Species distribution modeling was conducted to examine the influence of landscape scale variables and beach management strategies on bird breeding habitat suitability. The...
Categories: Data;
Types: ArcGIS REST Map Service,
ArcGIS Service Definition,
Downloadable,
Map Service,
OGC WFS Layer,
OGC WMS Layer,
OGC WMS Service;
Tags: Charadrius melodus,
Coastal,
Data,
Haematopus palliatus,
Hurricane Sandy,
Three types of data (one with an elevation model (DEM), one without a DEM, and one indicating the difference) are provided for the entire Northeast region and by analysis zone (n=8). Tidal Marsh Vegetation Classification, DEM, 3m, Northeast U.S. – contains a regional classification produced using a combination of Digital Elevation Model (DEM) and National Agriculture Imagery Program (NAIP) multispectral imagery. All eight cover types are included in this classification. This dataset combined with “Tidal Marsh Vegetation Classification, DEM, 3m, Northeast U.S” provides a contiguous classification of tidal marsh cover types from coastal Maine to Virginia. The eight cover types include: High marsh: Area flooded during...
Categories: Data;
Tags: Data,
LCC Network Science Catalog,
North Atlantic Landscape Conservation Cooperative Data.gov,
coast,
completed,
|

|
