Filters: Tags: Hydrology (X) > Date Range: {"choice":"month"} (X)
184 results (35ms)|
Filters
Date Types (for Date Range)
Types
Contacts
Categories Tag Types
|
This database contains information on peak flows (floods, hyperconcentrated flows, and debris flows) after wildfire. Data were collected from the scientific literature and the U.S. Geological Survey National Water Information System. These data provide a foundation to assess the upper limits of post-wildfire floods that imperil human lives, infrastructure, and water supplies. Literature citations for studies that the data were sourced from are contained in the file "bibliographyv2.rtf".
Categories: Data;
Tags: Hydrology,
USGS Science Data Catalog (SDC),
Water Quality,
Water Resources,
utilitiesCommunication,
A reach of the North Santiam River, Oregon, was used as a case study in an ongoing effort to develop and test image velocimetry algorithms for estimating surface flow velocities in river channels from remotely sensed data. Video was acquired from an unoccupied aircraft system, UAS, and used as input to the image velocimetry algorithms. Direct measurements of flow velocity were obtained using an acoustic Doppler current profiler, ADCP, and used to assess the accuracy of the image velocimetry algorithms. The UAS-based video was acquired from a DJI Matrice 210 quadcopter equipped with a Zenmuse X4S optical camera on July 25, 2022. The video is provided in its native form, with a frame rate of 30 Hertz and an *.mov...
Categories: Data;
Types: Map Service,
OGC WFS Layer,
OGC WMS Layer,
OGC WMS Service;
Tags: Hydrology,
Image velocimetry,
North Santiam River,
Oregon,
Remote Sensing,
These data were compiled to evaluate impacts of different reservoir management scenarios on sand exposure for aeolian landscape and cultural site resources. Objective of our study was to predict areas of dry, bare Colorado River sand as a function of different management alternative scenarios. These data represent predictions of dry, bare sand for the reach of the Colorado River between Glen Canyon Dam and Bright Angel Creek in Grand Canyon National Park. These data were created during 2023 by the U.S. Geological Survey, Southwest Biological Science Center, Grand Canyon Monitoring and Research Center. These data can be used to understand how the area of sand available for windblown transport might be impacted different...
One-percent annual exceedance probability (AEP) flood-flow estimates were computed at flood insurance study (FIS) locations across Pennsylvania using methods identified in Scientific Investigation Report (SIR) 2019-5094. Following guidance outlined in SIR 2016-5149, valid statistical reaches (VSRs) were identified for streamgages, which were used to assist with the determination of the applicable method used to compute a USGS-derived 1-percent AEP flood-flow estimate at an FIS location. Methods included: weighting, weighting and transferring, and regression equations. The USGS-derived 1-percent AEP flood-flow estimates were then compared to 1-percent AEP flood-flow estimates published in FIS's and furnished by the...
This data release contains radiocarbon dates and clumped isotope ratios for soil carbonates as well as observed soil temperatures for study sites in the San Luis Valley, Colorado and New Mexico, USA. The companion publication can be found at https://doi.org/10.1029/2023GC011221.
Categories: Data;
Types: Downloadable,
Map Service,
OGC WFS Layer,
OGC WMS Layer,
Shapefile;
Tags: Colorado,
Geochemistry,
Hydrology,
Land Use Change,
New Mexico,
High-frequency observations of surface water at fine spatial scales are critical to effectively manage aquatic habitat, flood risk and water quality. We developed inundation algorithms for Sentinel-1 and Sentinel-2 across 12 sites within the conterminous United States (CONUS) covering >536,000 km2 and representing diverse hydrologic and vegetation landscapes. These algorithms were trained on data from 13,412 points spread throughout the 12 sites. Each scene in the 5-year (2017-2021) time series was classified into open water, vegetated water, and non-water at 20 m resolution using variables not only from Sentinel-1 and Sentinel-2, but also variables derived from topographic and weather datasets. The Sentinel-1 model...

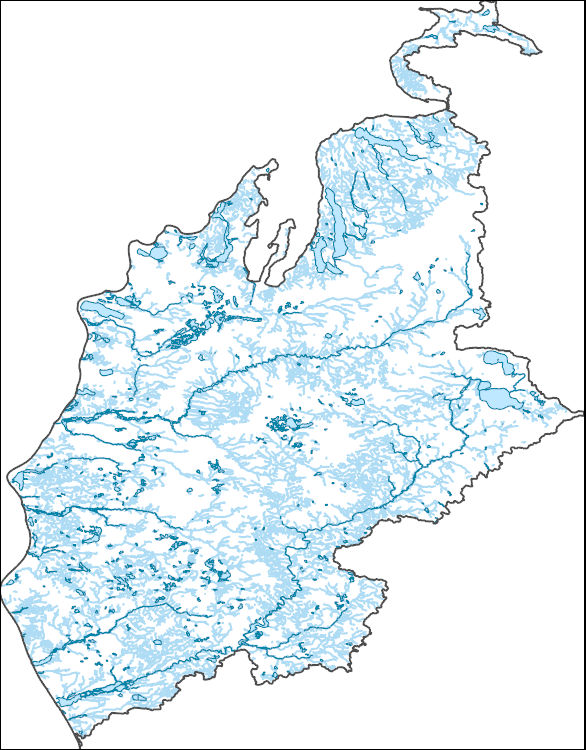
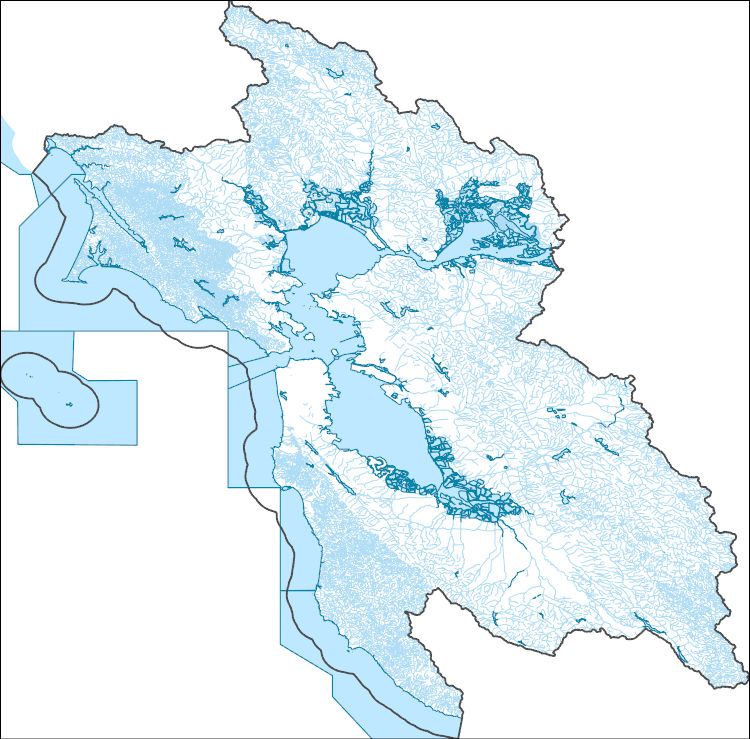
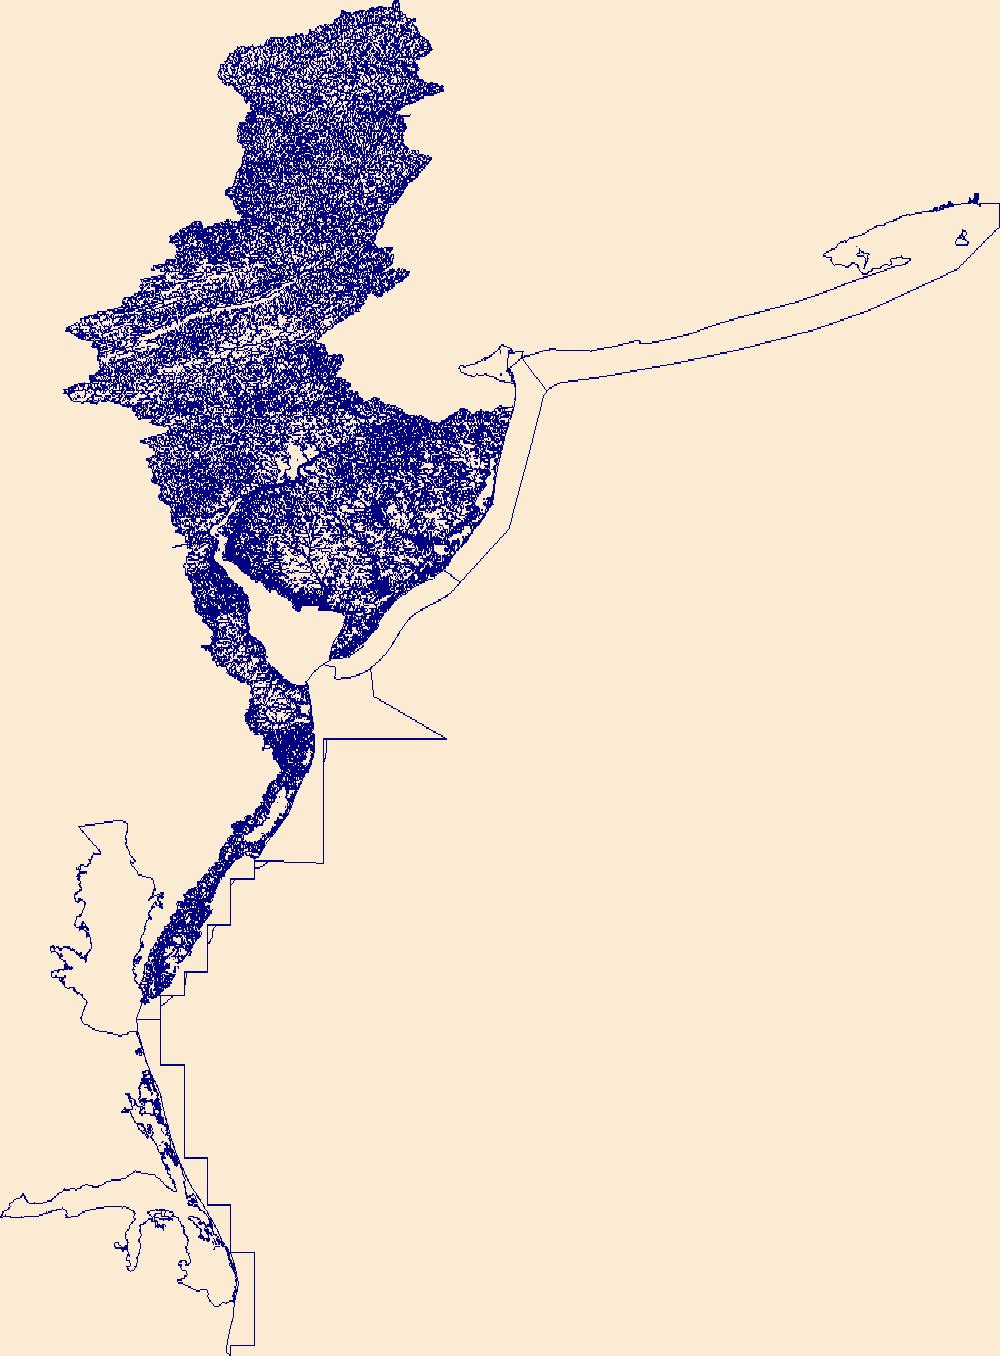
The High Resolution National Hydrography Dataset Plus (NHDPlus HR) is an integrated set of geospatial data layers, including the best available National Hydrography Dataset (NHD), the 10-meter 3D Elevation Program Digital Elevation Model (3DEP DEM), and the National Watershed Boundary Dataset (WBD). The NHDPlus HR combines the NHD, 3DEP DEMs, and WBD to create a stream network with linear referencing, feature naming, "value added attributes" (VAAs), elevation-derived catchments, and other features for hydrologic data analysis. The stream network with linear referencing is a system of data relationships applied to hydrographic systems so that one stream reach "flows" into another and "events" can be tied to and traced...

The High Resolution National Hydrography Dataset Plus (NHDPlus HR) is an integrated set of geospatial data layers, including the best available National Hydrography Dataset (NHD), the 10-meter 3D Elevation Program Digital Elevation Model (3DEP DEM), and the National Watershed Boundary Dataset (WBD). The NHDPlus HR combines the NHD, 3DEP DEMs, and WBD to create a stream network with linear referencing, feature naming, "value added attributes" (VAAs), elevation-derived catchments, and other features for hydrologic data analysis. The stream network with linear referencing is a system of data relationships applied to hydrographic systems so that one stream reach "flows" into another and "events" can be tied to and traced...
Dissolved oxygen estimates were generated to help understand how different alternative management scenarios may affect the likelihood of low dissolved oxygen in Glen Canyon Dam releases. The study aimed to examine the effects of different management alternatives on late summer and early fall dissolved oxygen concentrations in Glen Canyon Dam releases. The estimates represent estimates of dissolved oxygen concentration in Glen Canyon Dam releases between August and October of a given year. These estimates were generated using data collected in Lake Powell reservoir as part of a long-term inter-agency water quality monitoring program conducted by the Bureau of Reclamation, the National Park Service, and the U.S. Geological...
The Upper Delaware River is a unique example of an aquatic system where summer river temperature is actively managed for ecological purposes. River temperature at the mainstem Delaware River at Lordville, NY gage (USGS 01427207) is targeted to remain below 25°C, with warm events potentially mitigated via directed upstream reservoir releases, a process guided by predictive tools. These directed releases currently occur at the Cannonsville Dam on the West Branch, though the temperature criteria at the Lordville gage is also influenced by releases from the Pepacton Dam on the east branch. To increase the spatial resolution of summer river temperature data available for understanding river temperature processes and...
Categories: Data;
Types: Downloadable,
Map Service,
OGC WFS Layer,
OGC WMS Layer,
Shapefile;
Tags: New York,
Sullivan County,
USGS Science Data Catalog (SDC),
Upper Delaware River,
environment,
This U.S. Geological Survey (USGS) data release contains batch formatted annual peak streamflow data (PkFlows_AllSites.txt) through the 2020 water year for six selected USGS streamgages (01321000, 01342797, 01343060, 01346000, 01347000, and 01348000) that recorded the flood of October 31 – November 3, 2019, which severely affected the Mohawk Valley and southern Adirondack region in central New York State. This data release also contains batch formatted specification (PkFlows_AllSites.psf) and output (PEAKFLOWS_ALLSITES.PRT) files from log-Pearson type III (LPIII) flood-frequency analysis of the annual peak streamflow data in version 7.4 of the USGS PeakFQ software (Flynn and others, 2006), which implements the Bulletin...
Categories: Data;
Types: Map Service,
OGC WFS Layer,
OGC WMS Layer,
OGC WMS Service;
Tags: East Canada Creek,
Flood Science,
Groundwater and Streamflow Information,
Hydrology,
Low Flow or Peak Flow,
In 2019, the U.S. Geological Survey (USGS), in cooperation with the Blackfeet Water Department, initiated a multi-year hydrologic investigation of the Blackfeet Indian Reservation. The investigation was designed to increase understanding of the water resources of the Blackfeet Indian Reservation including Birch Creek which forms the southern boundary of the reservation. Streamflow is controlled in the headwaters of Birch Creek through the outflow from Swift Reservoir at Swift Dam. The data included in this data release was provided by the Pondera County Canal and Reservoir Company (PCCRC) and includes Swift Reservoir outflow daily streamflow values and daily streamflow values for three downstream diversions from...
This model archive provides all data, code, and modeling results used in Barclay and others (2023) to assess the ability of process-guided deep learning stream temperature models to accurately incorporate groundwater-discharge processes. We assessed the performance of an existing process-guided deep learning stream temperature model of the Delaware River Basin (USA) and explored four approaches for improving groundwater process representation: 1) a custom loss function that leverages the unique patterns of air and water temperature coupling resulting from different temperature drivers, 2) inclusion of additional groundwater-relevant catchment attributes, 3) incorporation of additional process model outputs, and...
This data release contains three sets of estimated values at selected sites within the Colorado River Basin: 1) daily specific conductance at 143 sites in the Upper Basin and 3 sites in the Lower Basin (WY 1980-2022); 2) daily baseflow discharge at 100 sites in the Upper Basin and 3 sites in the Lower Basin (WY 1980-2022); and 3) seasonal baseflow discharge and baseflow dissolved solids load at 143 sites in the Upper Basin (WY 1986-2020). The estimates of daily baseflow discharge will be used as input to an application of the USGS GSFLOW model, which is a coupled groundwater and surface-water flow model based on the integration of the USGS Precipitation-Runoff Modeling System (PRMS-V) and the USGS Modular Groundwater...
This model archival summary summarizes the suspended-sediment concentration (SSC; U.S. Geological Survey [USGS] parameter code 80154) model developed to compute 15-minute, hourly, or daily SSC from July 26, 2018, onward. This model is specific to USGS site 06887000, the Big Blue River near Manhattan, Kansas, during this study period and cannot be applied to data collected from other locations on the Big Blue River or data collected from other water bodies. The methods follow USGS guidance as referenced in relevant Office of Surface Water/Office of Water Quality Technical Memoranda and USGS Techniques and Methods, book 3, chapter C4 (Rasmussen and others, 2009; U.S. Geological Survey, 2016).
These data were collected by a SonTek Argonaut-XR 3000-MHz 3D acoustic Doppler current meter (ADCM) that was mounted on an approximately 75-pound mounting plate. The ADCM was deployed on the bottom of River Raisin at approximately 41.899978°N, -83.353548°E and took measurements from August 17-September 13, 2023. These data were collected in cooperation with U.S. Environmental Protection Agency (USEPA), to provide them with data that may help them better understand water velocities caused by river currents, ship traffic, or anything else that could cause the erosion of a 'cap' installed on the river bed that was designed to prevent the dispersion of contaminated soil. In reviewing the data it was noticed that on...
This tabular data set represents the percent of land cover classes in the riparian zone from the 2019 edition of the National Land Cover databases for the years 2001, 2004, 2006, 2008, 2011, 2013, 2016 and 2019 compiled for two spatial components of the NHDPlus version 2.1 data suite (NHDPlusv2) for the conterminous United States; 1) individual reach catchments and 2) reach catchments accumulated upstream through the river network. These databases can be linked to the NHDPlus version 2 data suite by the unique identifier COMID. The source data is the "National Land Cover Database (NLCD) 2019 Products (ver. 2.0, June 2021)" databases for the years 2001, 2004, 2006, 2008, 2011, 2013, 2016, and 2019 produced by the...

The High Resolution National Hydrography Dataset Plus (NHDPlus HR) is an integrated set of geospatial data layers, including the National Hydrography Dataset (NHD), National Watershed Boundary Dataset (WBD), and 3D Elevation Program Digital Elevation Model (3DEP DEM). The NHDPlus HR combines the NHD, 3DEP DEMs, and WBD to a data suite that includes the NHD stream network with linear referencing functionality, the WBD hydrologic units, elevation-derived catchment areas for each stream segment, "value added attributes" (VAAs), and other features that enhance hydrologic data analysis and routing.
U. S. Geological Survey (USGS) scientists completed a data collection campaign from the 25th of April to the 10th of June in 2022, using various methods to record geomorphic and habitat indicators throughout 30 streams on the Delmarva Peninsula. Field methods included GNSS surveys, gravelometer-based pebble count readings, visual assessments, and riparian analyses. These data contain all raw field metrics from the in-channel habitat assessment as well as the rapid riparian assessment. Any use of trade, firm, or product names is for descriptive purposes only and does not imply endorsement by the U.S. Government.
These data were compiled for Cabeza Prieta National Wildlife Refuge (CPNWR) in southern Arizona, to support managment efforts of water resources and wildlife conservation. Objective(s) of our study were to 1) measure water storage capacity at select stage heights in three tanks (also termed tinajas), 2) build a stage storage model to help CPNWR staff accurately estimate water volumes throughout the year, and 3) collect topographic data adjacent to the tanks as a means to help connect these survey data to past or future work. These data represent high-resolution (sub-meter) ground based lidar measurements used to meet these objectives and are provided as: processed lidar files (point clouds), rasters (digital elevation...
|

|