Filters: Tags: Iowa (X)
8,821 results (140ms)|
Filters
Date Range
Extensions Types
Contacts
Categories
Tag Types
|
This data set contains imagery from the National Agriculture Imagery Program (NAIP). The NAIP program is administered by USDA FSA and has been established to support two main FSA strategic goals centered on agricultural production. These are, increase stewardship of America's natural resources while enhancing the environment, and to ensure commodities are procured and distributed effectively and efficiently to increase food security. The NAIP program supports these goals by acquiring and providing ortho imagery that has been collected during the agricultural growing season in the U.S. The NAIP ortho imagery is tailored to meet FSA requirements and is a fundamental tool used to support FSA farm and conservation programs....
This data set contains imagery from the National Agriculture Imagery Program (NAIP). The NAIP program is administered by USDA FSA and has been established to support two main FSA strategic goals centered on agricultural production. These are, increase stewardship of America's natural resources while enhancing the environment, and to ensure commodities are procured and distributed effectively and efficiently to increase food security. The NAIP program supports these goals by acquiring and providing ortho imagery that has been collected during the agricultural growing season in the U.S. The NAIP ortho imagery is tailored to meet FSA requirements and is a fundamental tool used to support FSA farm and conservation programs....
In this paper, we present an economic analysis of CO2-enhanced oil recovery (EOR). This technique entails injection of CO2 into mature oil fields in a manner that reduces the oil's viscosity, thereby enhancing the rate of extraction. As part of this process, significant quantities of CO2 remain sequestered in the reservoir. If CO2 emissions are regulated, oil producers using EOR should therefore be able to earn revenues from sequestration as well as from oil production. We develop a theoretical framework that analyzes the dynamic co-optimization of oil extraction and CO2 sequestration, through the producer's choice of the fraction of CO2 in the injection stream at each moment. We find that the optimal fraction of...
The glacial aquifer system of the United States encompasses all or parts of 25 states and is the most widely used supply of drinking water in the Nation (Maupin and Barber, 2005; Maupin and Arnold, 2010). A series of seven raster data sets were derived from a database of water-well drillers' records that was compiled in partial fulfillment of the goals of the U.S. Geological Survey’s Groundwater Availability and Use assessment program (U.S. Geological Survey, 2002). They contain hydrogeologic information for areas of the U.S. that are north of the southern limit of Pleistocene glaciation, including the total thickness of glacial deposits, thickness of coarse-grained sediment within the glacial deposits, specific-capacity...
This data release component contains model inputs including river basin attributes, weather forcing data, and simulated and observed river discharge.
The U. S. Geological Survey (USGS) makes long-term seismic hazard forecasts that are used in building codes. The hazard models usually consider only natural seismicity; non-tectonic (man-made) earthquakes are excluded because they are transitory or too small. In the past decade, however, thousands of earthquakes related to underground fluid injection have occurred in the central and eastern U.S. (CEUS), and some have caused damage. In response, the USGS is now also making short-term forecasts that account for the hazard from these induced earthquakes. A uniform earthquake catalog is assembled by combining and winnowing pre-existing source catalogs. Seismicity statistics are analyzed to develop recurrence models,...
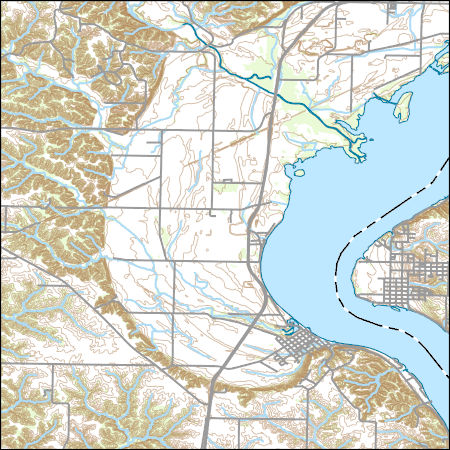
Layers of geospatial data include contours, boundaries, land cover, hydrography, roads, transportation, geographic names, structures, and other selected map features.
Types: Citation;
Tags: 7.5 x 7.5 minute,
7.5 x 7.5 minute,
Combined Vector,
Combined Vector,
Combined Vector,
Observed water temperatures from 1980-2019 were compiled for 2,332 lakes in the US. These data were used as training, test, and error-estimation data for process-guided deep learning models and the evaluation of process-based models. The data are formatted as a single csv (comma separated values) file with attributes corresponding to the unique combination of lake identifier, time, and depth. Data came from a variety of sources, including the Water Quality Portal, the North Temperate Lakes Long-Term Ecological Research Project, and digitized temperature records from the MN Department of Natural Resources. This dataset is part of a larger data release of lake temperature model inputs and outputs for these same lakes...

This map layer shows Indian lands of the United States. For the most part, only areas of 320 acres or more are included; some smaller areas deemed to be important or significant are also included. Federally-administered lands within a reservation are included for continuity; these may or may not be considered part of the reservation and are simply described with their feature type and the administrating Federal agency. Some established Indian lands which are larger than 320 acres are not included in this map layer because their boundaries were not available from the owning or administering agency.
This dataset provides shapefile outlines of the 7,150 lakes that had temperature modeled as part of this study. The format is a shapefile for all lakes combined (.shp, .shx, .dbf, and .prj files). A csv file of lake metadata is also included. This dataset is part of a larger data release of lake temperature model inputs and outputs for 7,150 lakes in the U.S. states of Minnesota and Wisconsin (http://dx.doi.org/10.5066/P9CA6XP8).
Categories: Data;
Types: Downloadable,
Map Service,
OGC WFS Layer,
OGC WMS Layer,
Shapefile;
Tags: IA,
IL,
IN,
Illinois,
Indiana,
Geographic distribution data were collected based on county level occurrences (or converted from point occurrences to county level occurrences) within the five focal states (Minnesota, North Dakota, South Dakota, Nebraska & Iowa) and each U.S. state or Canadian province bordering those focal states (Wisconsin, Illinois, Missouri, Kansas, Wyoming, & Montana in the USA and Saskatchewan, Ontario & Manitoba in Canada).
The U.S. Geological Survey (USGS) has developed and implemented an algorithm that identifies burned areas in dense time series of Landsat image stacks to produce the Landsat Burned Area Essential Climate Variable (BAECV) products. The algorithm makes use of predictors derived from individual Landsat scenes, lagged reference conditions, and change metrics between the scene and reference conditions. Outputs of the BAECV algorithm consist of pixel-level burn probabilities for each Landsat scene, and annual burn probability, burn classification, and burn date composites. These products were generated for the conterminous United States for 1984 through 2015. These data are also available for download at https://rmgsc.cr.usgs.gov/outgoing/baecv/BAECV_CONUS_v1.1_2017/...
The U.S. Geological Survey (USGS) has been engaged in airborne electromagnetics (AEM) since the 1970s, playing a role in the development of early acquisition systems, developing calibration methods, refining standards for data acquisition, improving data processing, modeling, and interpretation methods, and expanding the range of AEM applications. However, USGS AEM survey visibility and data accessibility has not advanced as rapidly as our use of the technique. This data release catalogs AEM surveys in the United States that have contributed to studies under USGS programs including Water, Geologic Mapping, Minerals, Energy, Environmental Health, Ecosystems, Hazards, and Climate. This dataset contains locations for...
Categories: Data;
Types: ArcGIS REST Map Service,
ArcGIS Service Definition,
Downloadable,
Map Service;
Tags: Alabama,
Arizona,
Arkansas,
California,
Colorado,
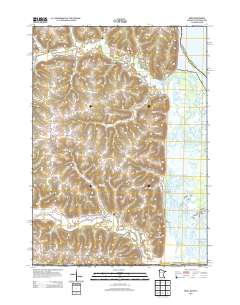
Layered GeoPDF 7.5 Minute Quadrangle Map. Layers of geospatial data include orthoimagery, roads, grids, geographic names, elevation contours, hydrography, and other selected map features.
Layered GeoPDF 7.5 Minute Quadrangle Map. Layers of geospatial data include orthoimagery, roads, grids, geographic names, elevation contours, hydrography, and other selected map features.
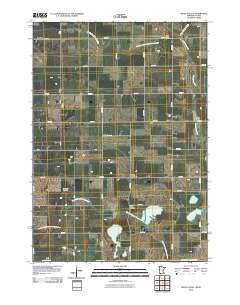
Layered GeoPDF 7.5 Minute Quadrangle Map. Layers of geospatial data include orthoimagery, roads, grids, geographic names, elevation contours, hydrography, and other selected map features.
Layered GeoPDF 7.5 Minute Quadrangle Map. Layers of geospatial data include orthoimagery, roads, grids, geographic names, elevation contours, hydrography, and other selected map features.
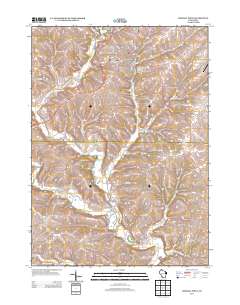
Layered geospatial PDF Map. Layers of geospatial data include orthoimagery, roads, grids, geographic names, elevation contours, hydrography, and other selected map features.
Layered GeoPDF 7.5 Minute Quadrangle Map. Layers of geospatial data include orthoimagery, roads, grids, geographic names, elevation contours, hydrography, and other selected map features.
Layered GeoPDF 7.5 Minute Quadrangle Map. Layers of geospatial data include orthoimagery, roads, grids, geographic names, elevation contours, hydrography, and other selected map features.
|

|
