Filters: Tags: JOHNSON CREEK (X)
22 results (52ms)|
Filters
Date Range
Extensions Types
Contacts
Categories Tag Types Tag Schemes |
This data set contains imagery from the National Agriculture Imagery Program (NAIP). The NAIP program is administered by USDA FSA and has been established to support two main FSA strategic goals centered on agricultural production. These are, increase stewardship of America's natural resources while enhancing the environment, and to ensure commodities are procured and distributed effectively and efficiently to increase food security. The NAIP program supports these goals by acquiring and providing ortho imagery that has been collected during the agricultural growing season in the U.S. The NAIP ortho imagery is tailored to meet FSA requirements and is a fundamental tool used to support FSA farm and conservation programs....
The basis for these features is U.S. Geological Survey Scientific Investigations Report 2017-5024 Flood Inundation Mapping Data for Johnson Creek near Sycamore, Oregon. The domain of the HEC-RAS hydraulic model is a 12.9-mile reach of Johnson Creek from just upstream of SE 174th Avenue in Portland, Oregon, to its confluence with the Willamette River. Some of the hydraulics used in the model were taken from Federal Emergency Management Agency, 2010, Flood Insurance Study, City of Portland, Oregon, Multnomah, Clackamas, and Washington Counties, Volume 1 of 3, November 26, 2010. The Digital Elevation Model (DEM) utilized for the project was developed from lidar data flown in 2015 and provided by the Oregon Department...
Types: Citation;
Tags: Johnson Creek,
Portland, Oregon,
Willamette Valley,
digital elevation models,
floods,
The basis for these features is U.S. Geological Survey Scientific Investigations Report 2017-5024 Flood Inundation Mapping Data for Johnson Creek near Sycamore, Oregon. The domain of the HEC-RAS hydraulic model is a 12.9-mile reach of Johnson Creek from just upstream of SE 174th Avenue in Portland, Oregon, to its confluence with the Willamette River. Some of the hydraulics used in the model were taken from Federal Emergency Management Agency, 2010, Flood Insurance Study, City of Portland, Oregon, Multnomah, Clackamas, and Washington Counties, Volume 1 of 3, November 26, 2010. The Digital Elevation Model (DEM) utilized for the project was developed from lidar data flown in 2015 and provided by the Oregon Department...
Categories: Data;
Types: Citation,
Downloadable,
Map Service,
OGC WFS Layer,
OGC WMS Layer,
Shapefile;
Tags: Johnson Creek,
Portland, Oregon,
Willamette Valley,
digital elevation models,
floods,
The basis for these features is U.S. Geological Survey Scientific Investigations Report 2017-5024 Flood Inundation Mapping Data for Johnson Creek near Sycamore, Oregon. The domain of the HEC-RAS hydraulic model is a 12.9-mile reach of Johnson Creek from just upstream of SE 174th Avenue in Portland, Oregon, to its confluence with the Willamette River. Some of the hydraulics used in the model were taken from Federal Emergency Management Agency, 2010, Flood Insurance Study, City of Portland, Oregon, Multnomah, Clackamas, and Washington Counties, Volume 1 of 3, November 26, 2010. The Digital Elevation Model (DEM) utilized for the project was developed from lidar data flown in 2015 and provided by the Oregon Department...
This data set contains imagery from the National Agriculture Imagery Program (NAIP). The NAIP program is administered by USDA FSA and has been established to support two main FSA strategic goals centered on agricultural production. These are, increase stewardship of America's natural resources while enhancing the environment, and to ensure commodities are procured and distributed effectively and efficiently to increase food security. The NAIP program supports these goals by acquiring and providing ortho imagery that has been collected during the agricultural growing season in the U.S. The NAIP ortho imagery is tailored to meet FSA requirements and is a fundamental tool used to support FSA farm and conservation programs....
The basis for these features is U.S. Geological Survey Scientific Investigations Report 2017-5024 Flood Inundation Mapping Data for Johnson Creek near Sycamore, Oregon. The domain of the HEC-RAS hydraulic model is a 12.9-mile reach of Johnson Creek from just upstream of SE 174th Avenue in Portland, Oregon, to its confluence with the Willamette River. Some of the hydraulics used in the model were taken from Federal Emergency Management Agency, 2010, Flood Insurance Study, City of Portland, Oregon, Multnomah, Clackamas, and Washington Counties, Volume 1 of 3, November 26, 2010. The Digital Elevation Model (DEM) utilized for the project was developed from lidar data flown in 2015 and provided by the Oregon Department...
Types: Citation;
Tags: Johnson Creek,
Portland, Oregon,
Willamette Valley,
digital elevation models,
floods,
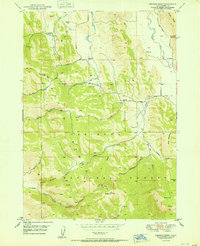
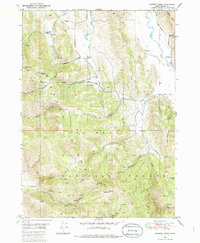
USGS Historical Quadrangle in GeoPDF.
This data set contains imagery from the National Agriculture Imagery Program (NAIP). The NAIP program is administered by USDA FSA and has been established to support two main FSA strategic goals centered on agricultural production. These are, increase stewardship of America's natural resources while enhancing the environment, and to ensure commodities are procured and distributed effectively and efficiently to increase food security. The NAIP program supports these goals by acquiring and providing ortho imagery that has been collected during the agricultural growing season in the U.S. The NAIP ortho imagery is tailored to meet FSA requirements and is a fundamental tool used to support FSA farm and conservation programs....
The basis for these features is U.S. Geological Survey Scientific Investigations Report 2017-5024 Flood Inundation Mapping Data for Johnson Creek near Sycamore, Oregon. The domain of the HEC-RAS hydraulic model is a 12.9-mile reach of Johnson Creek from just upstream of SE 174th Avenue in Portland, Oregon, to its confluence with the Willamette River. Some of the hydraulics used in the model were taken from Federal Emergency Management Agency, 2010, Flood Insurance Study, City of Portland, Oregon, Multnomah, Clackamas, and Washington Counties, Volume 1 of 3, November 26, 2010. The Digital Elevation Model (DEM) utilized for the project was developed from lidar data flown in 2015 and provided by the Oregon Department...
Categories: Data;
Types: Citation,
Downloadable,
Map Service,
OGC WFS Layer,
OGC WMS Layer,
Shapefile;
Tags: Johnson Creek,
Portland, Oregon,
Willamette Valley,
digital elevation models,
floods,
This data set contains imagery from the National Agriculture Imagery Program (NAIP). The NAIP program is administered by USDA FSA and has been established to support two main FSA strategic goals centered on agricultural production. These are, increase stewardship of America's natural resources while enhancing the environment, and to ensure commodities are procured and distributed effectively and efficiently to increase food security. The NAIP program supports these goals by acquiring and providing ortho imagery that has been collected during the agricultural growing season in the U.S. The NAIP ortho imagery is tailored to meet FSA requirements and is a fundamental tool used to support FSA farm and conservation programs....
The basis for these features is U.S. Geological Survey Scientific Investigations Report 2017-5024 Flood Inundation Mapping Data for Johnson Creek near Sycamore, Oregon. The domain of the HEC-RAS hydraulic model is a 12.9-mile reach of Johnson Creek from just upstream of SE 174th Avenue in Portland, Oregon, to its confluence with the Willamette River. Some of the hydraulics used in the model were taken from Federal Emergency Management Agency, 2010, Flood Insurance Study, City of Portland, Oregon, Multnomah, Clackamas, and Washington Counties, Volume 1 of 3, November 26, 2010. The Digital Elevation Model (DEM) utilized for the project was developed from lidar data flown in 2015 and provided by the Oregon Department...
Types: Citation;
Tags: Johnson Creek,
Portland, Oregon,
Willamette Valley,
digital elevation models,
floods,
The basis for these features is U.S. Geological Survey Scientific Investigations Report 2017-5024 Flood Inundation Mapping Data for Johnson Creek near Sycamore, Oregon. The domain of the HEC-RAS hydraulic model is a 12.9-mile reach of Johnson Creek from just upstream of SE 174th Avenue in Portland, Oregon, to its confluence with the Willamette River. Some of the hydraulics used in the model were taken from Federal Emergency Management Agency, 2010, Flood Insurance Study, City of Portland, Oregon, Multnomah, Clackamas, and Washington Counties, Volume 1 of 3, November 26, 2010. The Digital Elevation Model (DEM) utilized for the project was developed from lidar data flown in 2015 and provided by the Oregon Department...
Categories: Data;
Types: Citation,
Downloadable,
Map Service,
OGC WFS Layer,
OGC WMS Layer,
Shapefile;
Tags: Johnson Creek,
Portland, Oregon,
Willamette Valley,
digital elevation models,
floods,
The basis for these features is U.S. Geological Survey Scientific Investigations Report 2017-5024 Flood Inundation Mapping Data for Johnson Creek near Sycamore, Oregon. The domain of the HEC-RAS hydraulic model is a 12.9-mile reach of Johnson Creek from just upstream of SE 174th Avenue in Portland, Oregon, to its confluence with the Willamette River. Some of the hydraulics used in the model were taken from Federal Emergency Management Agency, 2010, Flood Insurance Study, City of Portland, Oregon, Multnomah, Clackamas, and Washington Counties, Volume 1 of 3, November 26, 2010. The Digital Elevation Model (DEM) utilized for the project was developed from lidar data flown in 2015 and provided by the Oregon Department...
Types: Citation;
Tags: Johnson Creek,
Portland, Oregon,
Willamette Valley,
digital elevation models,
floods,
The basis for these features is U.S. Geological Survey Scientific Investigations Report 2017-5024 Flood Inundation Mapping Data for Johnson Creek near Sycamore, Oregon. The domain of the HEC-RAS hydraulic model is a 12.9-mile reach of Johnson Creek from just upstream of SE 174th Avenue in Portland, Oregon, to its confluence with the Willamette River. Some of the hydraulics used in the model were taken from Federal Emergency Management Agency, 2010, Flood Insurance Study, City of Portland, Oregon, Multnomah, Clackamas, and Washington Counties, Volume 1 of 3, November 26, 2010. The Digital Elevation Model (DEM) utilized for the project was developed from lidar data flown in 2015 and provided by the Oregon Department...
Types: Citation;
Tags: Johnson Creek,
Portland, Oregon,
Willamette Valley,
digital elevation models,
floods,
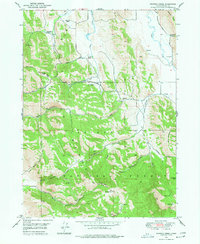
USGS Historical Quadrangle in GeoPDF.
The 1:100,000-scale geologic map database of the South Boston 30' × 60' quadrangle, Virginia and North Carolina, provides geologic information for the Piedmont along the I-85 and U.S. Route 58 corridors and in the Roanoke River watershed, which includes the John H. Kerr Reservoir and Lake Gaston. The Raleigh terrane (located on the eastern side of the map) contains Neoproterozoic to early Paleozoic(?) polydeformed, amphibolite-facies gneisses and schists. The Carolina slate belt of the Carolina terrane (located in the central part of the map) contains Neoproterozoic metavolcanic and metasedimentary rocks at greenschist facies. Although locally complicated, the slate-belt structure mapped across the South Boston...
USGS Historical Quadrangle in GeoPDF.
The basis for these features is U.S. Geological Survey Scientific Investigations Report 2017-5024 Flood Inundation Mapping Data for Johnson Creek near Sycamore, Oregon. The domain of the HEC-RAS hydraulic model is a 12.9-mile reach of Johnson Creek from just upstream of SE 174th Avenue in Portland, Oregon, to its confluence with the Willamette River. Some of the hydraulics used in the model were taken from Federal Emergency Management Agency, 2010, Flood Insurance Study, City of Portland, Oregon, Multnomah, Clackamas, and Washington Counties, Volume 1 of 3, November 26, 2010. The Digital Elevation Model (DEM) utilized for the project was developed from lidar data flown in 2015 and provided by the Oregon Department...
Types: Citation;
Tags: Johnson Creek,
Portland, Oregon,
Willamette Valley,
digital elevation models,
floods,
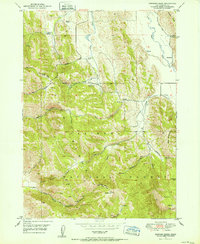
USGS Historical Quadrangle in GeoPDF.
|

|
