Filters: Tags: Kansas (X)
11,936 results (41ms)|
Filters
Date Range
Extensions Types Contacts
Categories
Tag Types
|
Future climates are simulated by general circulation models (GCM) using climate change scenarios (IPCC 2014). To project climate change for the sagebrush biome, we used 11 GCMs and two climate change scenarios from the IPCC Fifth Assessment, representative concentration pathways (RCPs) 4.5 and 8.5 (Moss et al. 2010, Van Vuuren et al. 2011). RCP4.5 scenario represents a future where climate policies limit and achieve stabilization of greenhouse gas concentrations to 4.5 W m-2 by 2100. RCP8.5 scenario might be called a business-as-usual scenario, where high emissions of greenhouse gases continue in the absence of climate change policies. The two selected time frames allow comparison of near-term (2020-2050) and longer-term...
Categories: Data;
Types: Citation,
Downloadable,
GeoTIFF,
Map Service,
Raster;
Tags: Arizona,
CRS,
California,
Climate,
Colorado,
This geodatabase contains the official boundary of the Southeast Aquatic Resource Partnership with State Boundaries. The boundary was originally developed by the United States Fish and Wildlife Service and was updated in 2020 to reflect revisions from the Southeast Aquatic Resource Partnership, a recognized Fish Habitat Partnership (FHP) of the National Fish Habitat Partnership.
Categories: Data;
Types: ArcGIS REST Map Service,
ArcGIS Service Definition,
Downloadable,
Map Service;
Tags: Alabama,
Analytical boundary,
Aquatic habitats,
Boundaries,
Boundary,
These data are high-resolution bathymetry (riverbed elevation) and depth-averaged velocities in ASCII format, generated from hydrographic and velocimetric surveys of the Missouri River near dual bridge structure A3665 on U.S. Highway 36 at St. Joseph, Missouri, in 2011, 2014, and 2018. Hydrographic data were collected using a high-resolution multibeam echosounder mapping system (MBMS), which consists of a multibeam echosounder (MBES) and an inertial navigation system (INS) mounted on a marine survey vessel. Data were collected as the vessel traversed the river along planned survey lines distributed throughout the reach. Data collection software integrated and stored the depth data from the MBES and the horizontal...
These data represent simulated soil temperature and moisture conditions for current climate, and for future climate represented by all available climate models at two time periods during the 21st century. These data were used to: 1) quantify the direction and magnitude of expected changes in several measures of soil temperature and soil moisture, including the key variables used to distinguish the regimes used in the R and R categories; 2) assess how these changes will impact the geographic distribution of soil temperature and moisture regimes; and 3) explore the implications for using R and R categories for estimating future ecosystem resilience and resistance.
This data set includes the relative production scenarios for eight (8) grass species based on linear models from Epstein, et al. (1998). We selected two indicator species for each community: shortgrass prairie: blue grama (Bouteloua gracilis; BOGR) and buffalo grass (Bouteloua dactyloides; BODA); mixedgrass prairie: sideoats grama (Bouteloua curtipendula; BOCU) and little bluestem (Schizachyrium scoparium; SCSC); tallgrass prairie: big bluestem (Andropogon gerardii; ANGE) and Indiangrass (Sorghastrum nutans; SONU); and semiarid grasslands: black grama (Bouteloua eriopoda; BOER) and tobosagrass (Pleuraphis mutica; PLMU). Soil texture (percent by weight) came from the Earth Systems Science Center (2008) which provided...

This map layer shows Indian lands of the United States. For the most part, only areas of 320 acres or more are included; some smaller areas deemed to be important or significant are also included. Federally-administered lands within a reservation are included for continuity; these may or may not be considered part of the reservation and are simply described with their feature type and the administrating Federal agency. Some established Indian lands which are larger than 320 acres are not included in this map layer because their boundaries were not available from the owning or administering agency.
The Critical Minerals in Archived Mine Samples Database (CMDB) contains chemistry and geologic information for historic ore and ore-related rock samples from mineral deposits in the United States. In addition, the database contains samples from archetypal deposits from 27 other countries in North America, South America, Asia, Africa and Europe. Samples were obtained from archived ore collections under the U.S. Geological Survey's project titled "Quick Assessment of Rare and Critical Metals in Ore Deposits: A National Assessment" (2008 to 2013) in an effort to begin an assessment of the Nations' previously mined ore deposits for critical minerals. Mineralized and altered rock samples were provided by the Colorado...
Categories: Data;
Types: ArcGIS REST Map Service,
ArcGIS Service Definition,
Downloadable,
Map Service,
OGC WFS Layer,
OGC WMS Layer,
Shapefile;
Tags: Alaska,
Argentina,
Arizona,
Arkansas,
Australia,
Geographic distribution data were collected based on county level occurrences (or converted from point occurrences to county level occurrences) within the five focal states (Minnesota, North Dakota, South Dakota, Nebraska & Iowa) and each U.S. state or Canadian province bordering those focal states (Wisconsin, Illinois, Missouri, Kansas, Wyoming, & Montana in the USA and Saskatchewan, Ontario & Manitoba in Canada).
The U.S. Geological Survey (USGS) has developed and implemented an algorithm that identifies burned areas in dense time series of Landsat image stacks to produce the Landsat Burned Area Essential Climate Variable (BAECV) products. The algorithm makes use of predictors derived from individual Landsat scenes, lagged reference conditions, and change metrics between the scene and reference conditions. Outputs of the BAECV algorithm consist of pixel-level burn probabilities for each Landsat scene, and annual burn probability, burn classification, and burn date composites. These products were generated for the conterminous United States for 1984 through 2015. These data are also available for download at https://rmgsc.cr.usgs.gov/outgoing/baecv/BAECV_CONUS_v1.1_2017/...
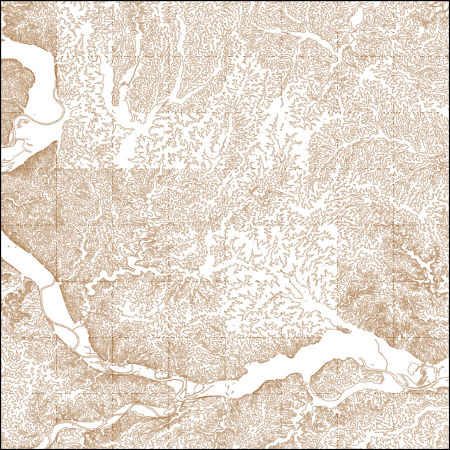
These vector contour lines are derived from the 3D Elevation Program using automated and semi-automated processes. They were created to support 1:24,000-scale CONUS and Hawaii, 1:25,000-scale Alaska, and 1:20,000-scale Puerto Rico / US Virgin Island topographic map products, but are also published in this GIS vector format. Contour intervals are assigned by 7.5-minute quadrangle, so this vector dataset is not visually seamless across quadrangle boundaries. The vector lines have elevation attributes (in feet above mean sea level on NAVD88), but this dataset does not carry line symbols or annotation.
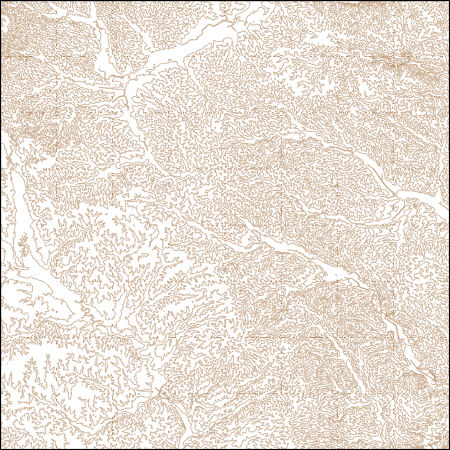
These vector contour lines are derived from the 3D Elevation Program using automated and semi-automated processes. They were created to support 1:24,000-scale CONUS and Hawaii, 1:25,000-scale Alaska, and 1:20,000-scale Puerto Rico / US Virgin Island topographic map products, but are also published in this GIS vector format. Contour intervals are assigned by 7.5-minute quadrangle, so this vector dataset is not visually seamless across quadrangle boundaries. The vector lines have elevation attributes (in feet above mean sea level on NAVD88), but this dataset does not carry line symbols or annotation.
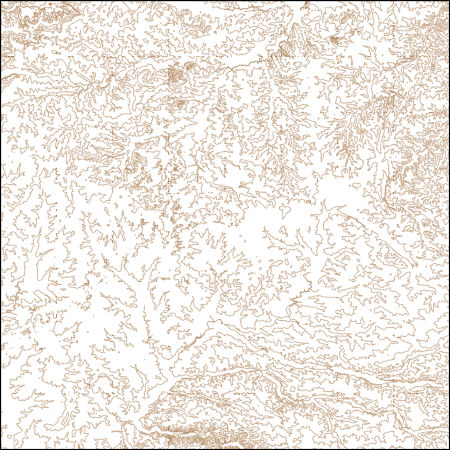
These vector contour lines are derived from the 3D Elevation Program using automated and semi-automated processes. They were created to support 1:24,000-scale CONUS and Hawaii, 1:25,000-scale Alaska, and 1:20,000-scale Puerto Rico / US Virgin Island topographic map products, but are also published in this GIS vector format. Contour intervals are assigned by 7.5-minute quadrangle, so this vector dataset is not visually seamless across quadrangle boundaries. The vector lines have elevation attributes (in feet above mean sea level on NAVD88), but this dataset does not carry line symbols or annotation.
The U.S. Geological Survey (USGS) has been engaged in airborne electromagnetics (AEM) since the 1970s, playing a role in the development of early acquisition systems, developing calibration methods, refining standards for data acquisition, improving data processing, modeling, and interpretation methods, and expanding the range of AEM applications. However, USGS AEM survey visibility and data accessibility has not advanced as rapidly as our use of the technique. This data release catalogs AEM surveys in the United States that have contributed to studies under USGS programs including Water, Geologic Mapping, Minerals, Energy, Environmental Health, Ecosystems, Hazards, and Climate. This dataset contains locations for...
Categories: Data;
Types: ArcGIS REST Map Service,
ArcGIS Service Definition,
Downloadable,
Map Service;
Tags: Alabama,
Arizona,
Arkansas,
California,
Colorado,
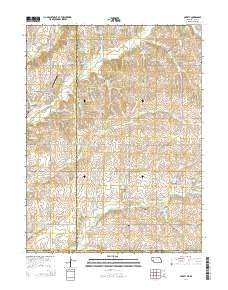
Layered GeoPDF 7.5 Minute Quadrangle Map. Layers of geospatial data include orthoimagery, roads, grids, geographic names, elevation contours, hydrography, and other selected map features.
Layered GeoPDF 7.5 Minute Quadrangle Map. Layers of geospatial data include orthoimagery, roads, grids, geographic names, elevation contours, hydrography, and other selected map features.
Layered GeoPDF 7.5 Minute Quadrangle Map. Layers of geospatial data include orthoimagery, roads, grids, geographic names, elevation contours, hydrography, and other selected map features.
Layered GeoPDF 7.5 Minute Quadrangle Map. Layers of geospatial data include orthoimagery, roads, grids, geographic names, elevation contours, hydrography, and other selected map features.
Layered GeoPDF 7.5 Minute Quadrangle Map. Layers of geospatial data include orthoimagery, roads, grids, geographic names, elevation contours, hydrography, and other selected map features.
Layered GeoPFD 7.5 Minute Quadrangle Map. Layers of geospatial data include orthoimagery, roads, grids, geographic names, elevation contours, hydrography, and other selected map features.
Layered GeoPDF 7.5 Minute Quadrangle Map. Layers of geospatial data include orthoimagery, roads, grids, geographic names, elevation contours, hydrography, and other selected map features.
|

|
