Filters: Tags: Kilauea Crater (X) > partyWithName: U.S. Geological Survey (X)
9 results (32ms)|
Filters
Date Range
Types Contacts
Categories Tag Types Tag Schemes
|
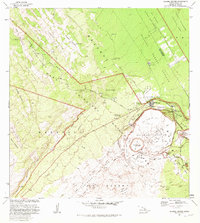
USGS Historical Quadrangle in GeoPDF.

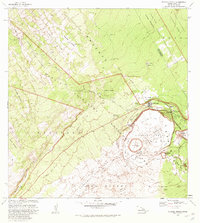
USGS Historical Quadrangle in GeoPDF.
The dataset includes tiltmeter data at a sample rate of 1 sample per minute from a downhole tiltmeter at Uwekahuna Vault (UWE). Location is -155.291162, 19.420972 (NAD83), elevation 1257 m. Data has two orientations for each time sample (north and east). Each file contains a year of data. The original datasource removes the mean, so the ends of subsequent files will not align. The absolute value of tilt has little value, so the user should manually shift the records by a constant if alignment is required between year files.
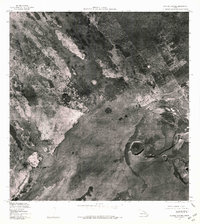
USGS Historical Quadrangle in GeoPDF.

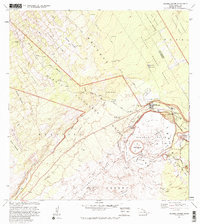
USGS Historical Quadrangle in GeoPDF.
In 2018, a large effusive eruption on the lower flank of Kīlauea Volcano was associated with collapse and subsidence of the summit caldera floor (Neal and others, 2019). The bottom of Halemaʻumaʻu, a crater nested within the summit caldera, subsided by more than 500 m. In July 2019, water was observed ponding on the deepest part of the Halemaʻumaʻu crater floor and the water rose and enlarged in area steadily over the next 16 months (Ingebritsen and others, 2020; Nadeau and others, 2020; Patrick and others, 2021). During the course of the rise, the lake surface appearance was highly dynamic and segmented, showing regions of variable color that changed from day to day (Nadeau and others, 2020). In June 2020 staff...
Categories: Data;
Types: Map Service,
OGC WFS Layer,
OGC WMS Layer,
OGC WMS Service;
Tags: Halemaʻumaʻu,
Hydrology,
Kīlauea Crater,
Remote Sensing,
USGS Science Data Catalog (SDC),
USGS Historical Quadrangle in GeoPDF.
This report documents the SO2 emission rates for the period 2014-2017, from the summit and East Rift Zone eruptions of Kīlauea, along with the wind or plume speed and direction data used to calculate the emission rates. The Kīlauea summit SO2 emission rates are reported every ten seconds, as measured by a novel configuration of 10 fixed, upward looking UV spectrometers (FLYSPEC array), and for days with at least 2 hours of data, the daily means are reported. The plume or wind speeds used to calculate the emission rates are measured by cross correlation of plume features (see William-Jones and others (2006)) or by ground-based anemometer (SDH) and are reported with the emission rates. When the SDH ground based wind...
Categories: Data;
Tags: FLYSPEC array,
Halema'uma'u,
Kilauea Crater,
Kilauea East Rift Zone,
Kilauea volcano,
USGS Historical Quadrangle in GeoPDF.
|

|
