Filters: Tags: LODI (X)
100 results (45ms)|
Filters
Date Range
Extensions Types Contacts
Categories Tag Types Tag Schemes |
This data set contains imagery from the National Agriculture Imagery Program (NAIP). The NAIP program is administered by USDA FSA and has been established to support two main FSA strategic goals centered on agricultural production. These are, increase stewardship of America's natural resources while enhancing the environment, and to ensure commodities are procured and distributed effectively and efficiently to increase food security. The NAIP program supports these goals by acquiring and providing ortho imagery that has been collected during the agricultural growing season in the U.S. The NAIP ortho imagery is tailored to meet FSA requirements and is a fundamental tool used to support FSA farm and conservation programs....
This data set contains imagery from the National Agriculture Imagery Program (NAIP). The NAIP program is administered by USDA FSA and has been established to support two main FSA strategic goals centered on agricultural production. These are, increase stewardship of America's natural resources while enhancing the environment, and to ensure commodities are procured and distributed effectively and efficiently to increase food security. The NAIP program supports these goals by acquiring and providing ortho imagery that has been collected during the agricultural growing season in the U.S. The NAIP ortho imagery is tailored to meet FSA requirements and is a fundamental tool used to support FSA farm and conservation programs....
This data set contains imagery from the National Agriculture Imagery Program (NAIP). The NAIP program is administered by USDA FSA and has been established to support two main FSA strategic goals centered on agricultural production. These are, increase stewardship of America's natural resources while enhancing the environment, and to ensure commodities are procured and distributed effectively and efficiently to increase food security. The NAIP program supports these goals by acquiring and providing ortho imagery that has been collected during the agricultural growing season in the U.S. The NAIP ortho imagery is tailored to meet FSA requirements and is a fundamental tool used to support FSA farm and conservation programs....
This data set contains imagery from the National Agriculture Imagery Program (NAIP). The NAIP program is administered by USDA FSA and has been established to support two main FSA strategic goals centered on agricultural production. These are, increase stewardship of America's natural resources while enhancing the environment, and to ensure commodities are procured and distributed effectively and efficiently to increase food security. The NAIP program supports these goals by acquiring and providing ortho imagery that has been collected during the agricultural growing season in the U.S. The NAIP ortho imagery is tailored to meet FSA requirements and is a fundamental tool used to support FSA farm and conservation programs....
This data set consists of 59 wideband magnetotelluric (MT) stations collected by the U.S. Geological Survey in July and August of 2020 as part of a 1-year project funded by the Energy Resources Program of the U.S. Geological Survey to demonstrate full crustal control on geothermal systems in the Great Basin. Each station had 5 components, 3 orthogonal magnetic induction coils and 2 horizontal orthogonal electric dipoles. Data were collected for an average of 18 hours on a repeating schedule of alternating sampling rates of 256 samples/second for 7 hours and 50 minutes and 4096 samples/second for 10 minutes. The schedules were set such that each station was recording the same schedule to allow for remote reference...
This data set consists of 59 wideband magnetotelluric (MT) stations collected by the U.S. Geological Survey in July and August of 2020 as part of a 1-year project funded by the Energy Resources Program of the U.S. Geological Survey to demonstrate full crustal control on geothermal systems in the Great Basin. Each station had 5 components, 3 orthogonal magnetic induction coils and 2 horizontal orthogonal electric dipoles. Data were collected for an average of 18 hours on a repeating schedule of alternating sampling rates of 256 samples/second for 7 hours and 50 minutes and 4096 samples/second for 10 minutes. The schedules were set such that each station was recording the same schedule to allow for remote reference...
This data set consists of 59 wideband magnetotelluric (MT) stations collected by the U.S. Geological Survey in July and August of 2020 as part of a 1-year project funded by the Energy Resources Program of the U.S. Geological Survey to demonstrate full crustal control on geothermal systems in the Great Basin. Each station had 5 components, 3 orthogonal magnetic induction coils and 2 horizontal orthogonal electric dipoles. Data were collected for an average of 18 hours on a repeating schedule of alternating sampling rates of 256 samples/second for 7 hours and 50 minutes and 4096 samples/second for 10 minutes. The schedules were set such that each station was recording the same schedule to allow for remote reference...
This data set consists of 59 wideband magnetotelluric (MT) stations collected by the U.S. Geological Survey in July and August of 2020 as part of a 1-year project funded by the Energy Resources Program of the U.S. Geological Survey to demonstrate full crustal control on geothermal systems in the Great Basin. Each station had 5 components, 3 orthogonal magnetic induction coils and 2 horizontal orthogonal electric dipoles. Data were collected for an average of 18 hours on a repeating schedule of alternating sampling rates of 256 samples/second for 7 hours and 50 minutes and 4096 samples/second for 10 minutes. The schedules were set such that each station was recording the same schedule to allow for remote reference...
This data set consists of 59 wideband magnetotelluric (MT) stations collected by the U.S. Geological Survey in July and August of 2020 as part of a 1-year project funded by the Energy Resources Program of the U.S. Geological Survey to demonstrate full crustal control on geothermal systems in the Great Basin. Each station had 5 components, 3 orthogonal magnetic induction coils and 2 horizontal orthogonal electric dipoles. Data were collected for an average of 18 hours on a repeating schedule of alternating sampling rates of 256 samples/second for 7 hours and 50 minutes and 4096 samples/second for 10 minutes. The schedules were set such that each station was recording the same schedule to allow for remote reference...
This data set consists of 59 wideband magnetotelluric (MT) stations collected by the U.S. Geological Survey in July and August of 2020 as part of a 1-year project funded by the Energy Resources Program of the U.S. Geological Survey to demonstrate full crustal control on geothermal systems in the Great Basin. Each station had 5 components, 3 orthogonal magnetic induction coils and 2 horizontal orthogonal electric dipoles. Data were collected for an average of 18 hours on a repeating schedule of alternating sampling rates of 256 samples/second for 7 hours and 50 minutes and 4096 samples/second for 10 minutes. The schedules were set such that each station was recording the same schedule to allow for remote reference...
This data set consists of 59 wideband magnetotelluric (MT) stations collected by the U.S. Geological Survey in July and August of 2020 as part of a 1-year project funded by the Energy Resources Program of the U.S. Geological Survey to demonstrate full crustal control on geothermal systems in the Great Basin. Each station had 5 components, 3 orthogonal magnetic induction coils and 2 horizontal orthogonal electric dipoles. Data were collected for an average of 18 hours on a repeating schedule of alternating sampling rates of 256 samples/second for 7 hours and 50 minutes and 4096 samples/second for 10 minutes. The schedules were set such that each station was recording the same schedule to allow for remote reference...
This data set consists of 59 wideband magnetotelluric (MT) stations collected by the U.S. Geological Survey in July and August of 2020 as part of a 1-year project funded by the Energy Resources Program of the U.S. Geological Survey to demonstrate full crustal control on geothermal systems in the Great Basin. Each station had 5 components, 3 orthogonal magnetic induction coils and 2 horizontal orthogonal electric dipoles. Data were collected for an average of 18 hours on a repeating schedule of alternating sampling rates of 256 samples/second for 7 hours and 50 minutes and 4096 samples/second for 10 minutes. The schedules were set such that each station was recording the same schedule to allow for remote reference...
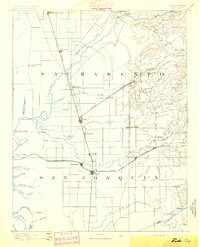
USGS Historical Quadrangle in GeoPDF.
This data set consists of 59 wideband magnetotelluric (MT) stations collected by the U.S. Geological Survey in July and August of 2020 as part of a 1-year project funded by the Energy Resources Program of the U.S. Geological Survey to demonstrate full crustal control on geothermal systems in the Great Basin. Each station had 5 components, 3 orthogonal magnetic induction coils and 2 horizontal orthogonal electric dipoles. Data were collected for an average of 18 hours on a repeating schedule of alternating sampling rates of 256 samples/second for 7 hours and 50 minutes and 4096 samples/second for 10 minutes. The schedules were set such that each station was recording the same schedule to allow for remote reference...
This data set consists of 59 wideband magnetotelluric (MT) stations collected by the U.S. Geological Survey in July and August of 2020 as part of a 1-year project funded by the Energy Resources Program of the U.S. Geological Survey to demonstrate full crustal control on geothermal systems in the Great Basin. Each station had 5 components, 3 orthogonal magnetic induction coils and 2 horizontal orthogonal electric dipoles. Data were collected for an average of 18 hours on a repeating schedule of alternating sampling rates of 256 samples/second for 7 hours and 50 minutes and 4096 samples/second for 10 minutes. The schedules were set such that each station was recording the same schedule to allow for remote reference...
This data set consists of 59 wideband magnetotelluric (MT) stations collected by the U.S. Geological Survey in July and August of 2020 as part of a 1-year project funded by the Energy Resources Program of the U.S. Geological Survey to demonstrate full crustal control on geothermal systems in the Great Basin. Each station had 5 components, 3 orthogonal magnetic induction coils and 2 horizontal orthogonal electric dipoles. Data were collected for an average of 18 hours on a repeating schedule of alternating sampling rates of 256 samples/second for 7 hours and 50 minutes and 4096 samples/second for 10 minutes. The schedules were set such that each station was recording the same schedule to allow for remote reference...
This data set consists of 59 wideband magnetotelluric (MT) stations collected by the U.S. Geological Survey in July and August of 2020 as part of a 1-year project funded by the Energy Resources Program of the U.S. Geological Survey to demonstrate full crustal control on geothermal systems in the Great Basin. Each station had 5 components, 3 orthogonal magnetic induction coils and 2 horizontal orthogonal electric dipoles. Data were collected for an average of 18 hours on a repeating schedule of alternating sampling rates of 256 samples/second for 7 hours and 50 minutes and 4096 samples/second for 10 minutes. The schedules were set such that each station was recording the same schedule to allow for remote reference...
This data set consists of 59 wideband magnetotelluric (MT) stations collected by the U.S. Geological Survey in July and August of 2020 as part of a 1-year project funded by the Energy Resources Program of the U.S. Geological Survey to demonstrate full crustal control on geothermal systems in the Great Basin. Each station had 5 components, 3 orthogonal magnetic induction coils and 2 horizontal orthogonal electric dipoles. Data were collected for an average of 18 hours on a repeating schedule of alternating sampling rates of 256 samples/second for 7 hours and 50 minutes and 4096 samples/second for 10 minutes. The schedules were set such that each station was recording the same schedule to allow for remote reference...
This data set consists of 59 wideband magnetotelluric (MT) stations collected by the U.S. Geological Survey in July and August of 2020 as part of a 1-year project funded by the Energy Resources Program of the U.S. Geological Survey to demonstrate full crustal control on geothermal systems in the Great Basin. Each station had 5 components, 3 orthogonal magnetic induction coils and 2 horizontal orthogonal electric dipoles. Data were collected for an average of 18 hours on a repeating schedule of alternating sampling rates of 256 samples/second for 7 hours and 50 minutes and 4096 samples/second for 10 minutes. The schedules were set such that each station was recording the same schedule to allow for remote reference...
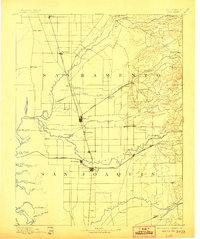
USGS Historical Quadrangle in GeoPDF.
|

|
