Filters: Tags: Land Cover (X)
989 results (135ms)|
Filters
Date Range
Extensions Types
Contacts
Categories Tag Types
|
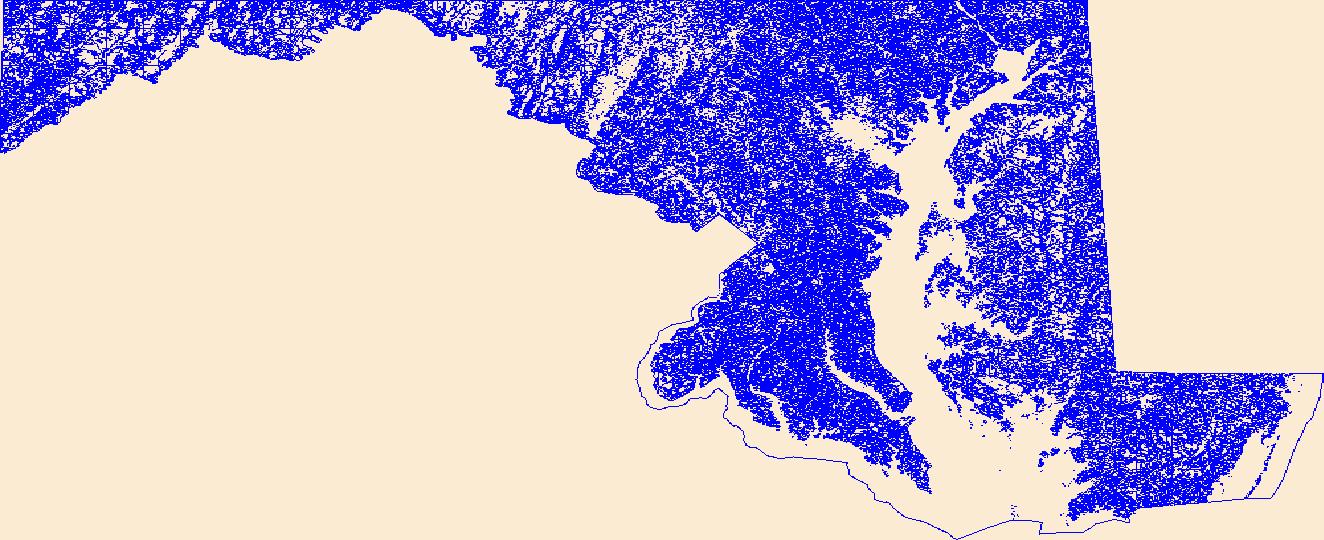
Geospatial data that is a derivative land cover product depicting woodland on topographic maps.
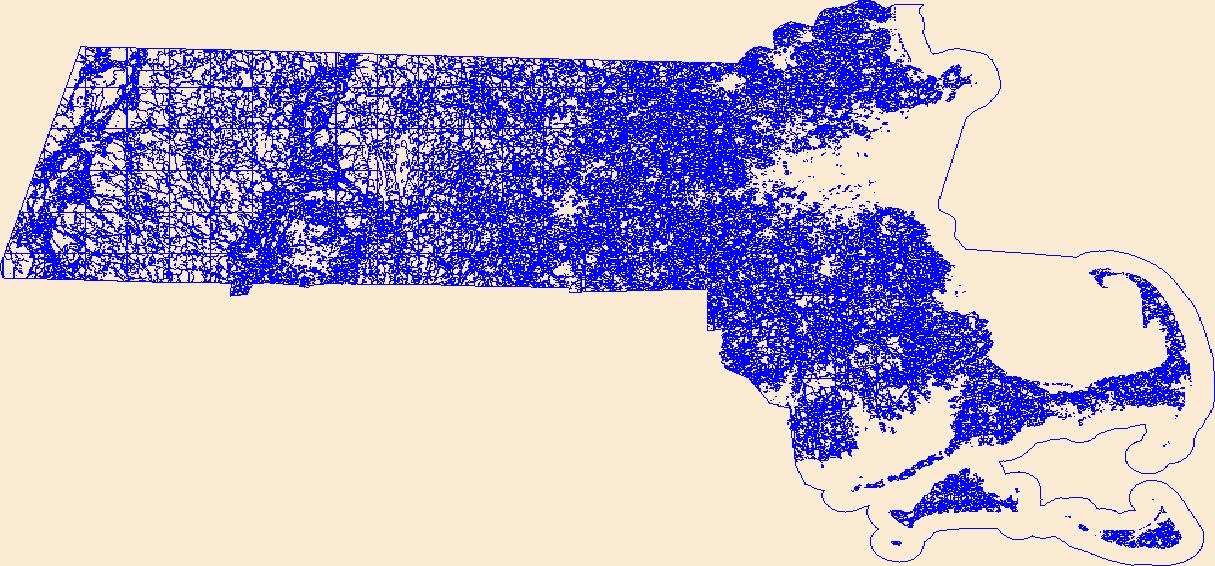
Geospatial data that is a derivative land cover product depicting woodland on topographic maps.
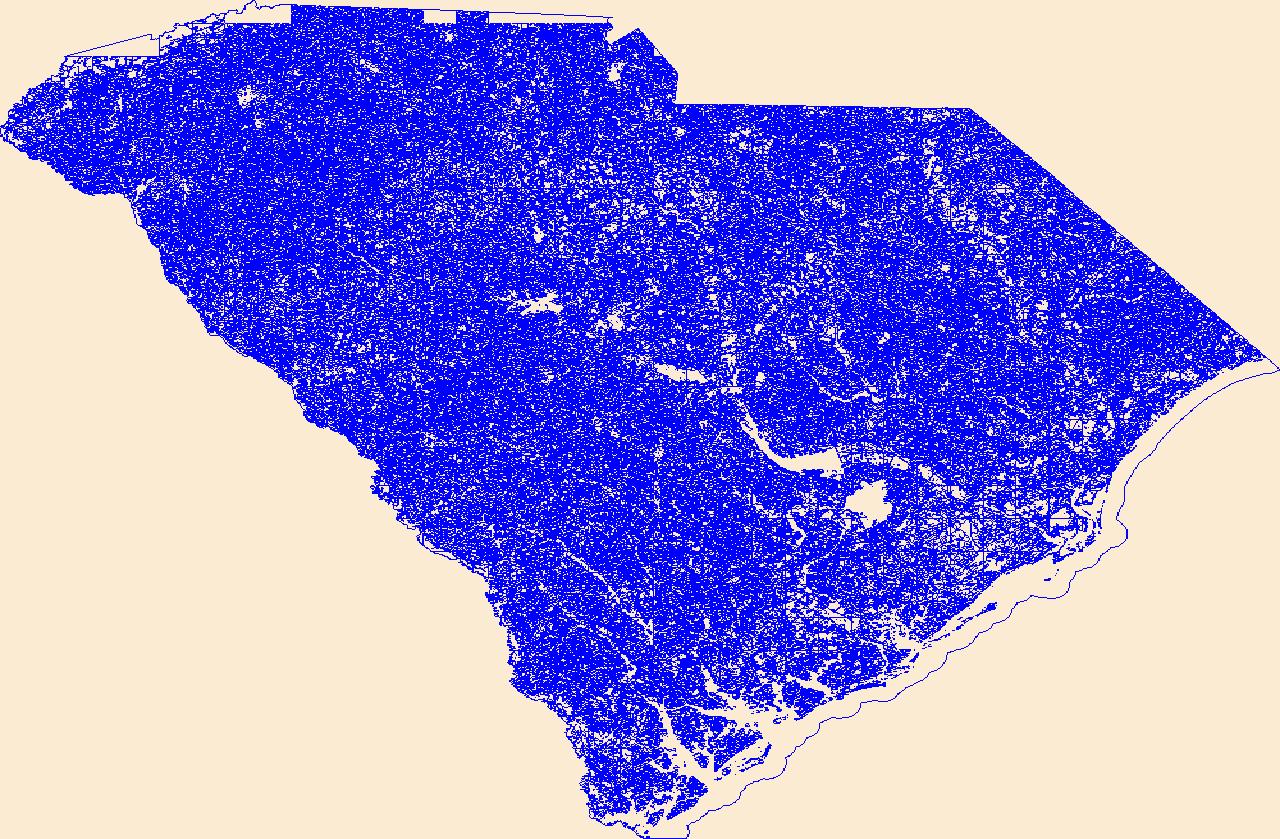
Geospatial data that is a derivative land cover product depicting woodland on topographic maps.
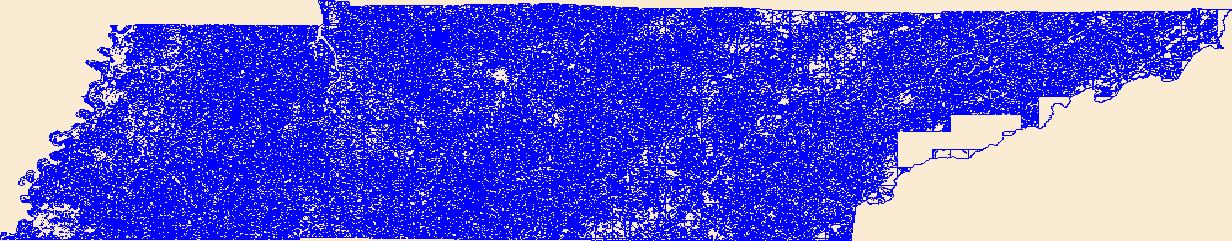
Geospatial data that is a derivative land cover product depicting woodland on topographic maps.
Geospatial data that is a derivative land cover product depicting woodland on topographic maps.
Geospatial data that is a derivative land cover product depicting woodland on topographic maps.

This dataset is an extract from the GlobCover 2009 land cover map, covering northern Asia. The GlobCover 2009 land cover map is derived by an automatic and regionally-tuned classification of a time series of global MERIS (MEdium Resolution Imaging Spectrometer) FR mosaics for the year 2009. The global land cover map counts 22 land cover classes defined with the United Nations (UN) Land Cover Classification System (LCCS). For more information on the GlobCover project, see http://ionia1.esrin.esa.int/ Note on display: class 210: Water Bodies is set to "transparent" to improve display in the Data Basin map. Within the extract's extent, no data were removed from the original dataset.

This dataset portrays 28 forest type groups across the contiguous United States. These data were derived from MODIS composite images from the 2002 and 2003 growing seasons in combination with nearly 100 other geospatial data layers, including elevation, slope, aspect, ecoregions, and PRISM climate data. The dataset was developed as a collaborative effort between the USFS Forest Inventory and Analysis and Forest Health Monitoring programs and the USFS Remote Sensing Applications Center.

Using mapped watersheds as a unit for summary statistics, we provide a series of indicators focused on land-based sources of threat within the US Virgin Islands. This includes indicators of a) the relative vulnerability of the land to erosion (based on slope, precipitation and soil erodibility); b) the relative erosion potential (REP) of the land, based on the relative vulnerability of the land, coupled with the current land cover type; c) the sediment delivery rate for each basin (percentage of eroded which reaches the river mouth); d) estimated sediment delivery for the basin, given current land use; e) the road density within the basin, and f) indicators of how erosion prone areas with roads might be (average...

This dataset portrays 28 forest type groups across Alaska. These data were derived from MODIS composite images from the 2002 and 2003 growing seasons in combination with nearly 100 other geospatial data layers, including elevation, slope, aspect, and ecoregions. The dataset was developed as a collaborative effort between the USFS Forest Inventory and Analysis and Forest Health Monitoring programs and the USFS Remote Sensing Applications Center.

For areas with roads, we have developed a simple indicator of the erosivity of the land based on physical factors of the location (slope, precipitation, and a soil characteristic called K-factor, which reflects the erodibility of the given soil type.) This indicator provides a rough indication of the relative erosion that might be resulting from road construction and runoff from roads in the range of locations on the US Virgin Islands. It identifies the roads likely to be contributing the most erosion to the watershed.

This dataset shows summary statistics for relative erosion rate (REP), river flow, and sediment delivery estimated for each of over 3,000 watersheds draining into the Caribbean Sea and Gulf of Mexico. This dataset is a combination of the region wide 1 km analysis and the higher resolution 270 m analysis for the islands of the eastern Caribbean.
Here we compare pollen identification results derived from light microscopy and DNA sequencing techniques of a robust number of samples collected from honey bee colonies embedded within intensive agricultural landscapes in the Northern Great Plains. We collected pollen samples from colonies within 6 apiaries in 2010 and 2011. For each pollen sample, we identified pollen grains via light microscopy and provide the number of grain counts-per-million. A separate aliquot of each pollen sample subjected to light microscope identification was also used for DNA sequencing analysis. We provide the plant operational taxonomic unit (OTU) for all base pair reads as the number of reads-per-million.

This is the flowline feature in the NHD plus dataset for region 18 with just the streams and rivers designated as perrenial. For full attribute definition, consult the NHD plus user guide. TNC joined the attributes from the tbl_nhd_flowlineattributesflow table in the geodatabase to get all of the relevant attributes. The NHDPlus Version 1.0 is an integrated suite of application-ready geospatial data sets that incorporate many of the best features of the National Hydrography Dataset (NHD) and the National Elevation Dataset (NED). The NHDPlus includes a stream network (based on the 1:100,000-scale NHD), improved networking, naming, and "value-added attributes" (VAA's). NHDPlus also includes elevation-derived catchments...

Zone 3 (covering parts of Louisiana, Mississippi, Alabama, and Florida) of the contiguous U.S. land cover dataset, NLCD 2006, released 2/16/2011. The full dataset is divided into 25 zones, which can all be found in the NLCD 2006 gallery. The National Land Cover Database products are created through a cooperative project conducted by the Multi-Resolution Land Characteristics (MRLC) Consortium. The MRLC Consortium is a partnership of federal agencies (www.mrlc.gov), consisting of the U.S. Geological Survey (USGS), the National Oceanic and Atmospheric Administration (NOAA), the U.S. Environmental Protection Agency (EPA), the U.S. Department of Agriculture (USDA), the U.S. Forest Service (USFS), the National Park...
The USGS through the Land Cover Institute serves as a facilitator for land cover and land use science, applications, and production functions. The institute assists in the availability and technical support of land cover data sets through increasing public and scientific awareness of the importance of land cover science. The USGS currently houses the institute at the Center for Earth Resources Observation and Science (EROS) in Sioux Falls, South Dakota. The LCI will address land cover topics from local to global scales, and in both domestic and international settings.

Zone 4 (covering parts of Florida, Alabama, and Georgia) of the contiguous U.S. land cover dataset, NLCD 2006, released 2/16/2011. The full dataset is divided into 25 zones, which can all be found in the NLCD 2006 gallery. The National Land Cover Database products are created through a cooperative project conducted by the Multi-Resolution Land Characteristics (MRLC) Consortium. The MRLC Consortium is a partnership of federal agencies (www.mrlc.gov), consisting of the U.S. Geological Survey (USGS), the National Oceanic and Atmospheric Administration (NOAA), the U.S. Environmental Protection Agency (EPA), the U.S. Department of Agriculture (USDA), the U.S. Forest Service (USFS), the National Park Service (NPS),...
Vegetation within the Cape Cod N.S. based on 2001 true color aerial images with reference to 2000 color IR aerial photos
This dataset is the first (circa 2000) of two 500-meter land use land cover (LULC) time-periods datasets (2000, and 2013) aids in monitoring change in West Africa’s land resources. To monitor and map these changes, a 26 general LULC class system was used. The classification system that was developed was primarily inspired by the “Yangambi Classification” (Trochain, 1957). This fairly broad class system for LULC was used because the classes can be readily identified on Landsat satellite imagery. A visual photo-interpretation approach was used to identify and map the LULC classes represented on Landsat images. The Rapid Land Cover Mapper (RLCM) was used to facilitate the photo-interpretation using Esri’s ArcGIS Desktop...
Categories: Data;
Types: Downloadable,
GeoTIFF,
Map Service,
Raster;
Tags: Cape Verde,
Capo Verde,
biota,
land cover,
land use,
The National Land Cover Database products are created through a cooperative project conducted by the Multi-Resolution Land Characteristics (MRLC) Consortium. The MRLC Consortium is a partnership of federal agencies (www.mrlc.gov), consisting of the U.S. Geological Survey (USGS), the National Oceanic and Atmospheric Administration (NOAA), the U.S. Environmental Protection Agency (EPA), the U.S. Department of Agriculture (USDA), the U.S. Forest Service (USFS), the National Park Service (NPS), the U.S. Fish and Wildlife Service (FWS), the Bureau of Land Management (BLM) and the USDA Natural Resources Conservation Service (NRCS). Previously, NLCD consisted of three major data releases based on a 10-year cycle. These...
|

|
