Filters: Tags: Land cover (X)
989 results (18ms)|
Filters
Date Range
Extensions Types
Contacts
Categories Tag Types
|
In the late 1880's and early 1900's the Mississippi River Commission (MRC) conducted an extensive high-resolution survey of the Mississippi River from Cairo, Illinois to Minneapolis, Minnesota. These data were published as a series of 89 survey maps and index. In the 1990's, the Upper Midwest Environmental Sciences Center (UMESC) in conjunction with the US Army Corps of Engineers Upper Mississippi River Restoration- Environmental Management Program -- Long Term Resource Monitoring Program element (LTRMP) for the Upper Mississippi River automated the maps' land cover/use symbology to create a turn of the century/pre-impoundment land cover/use data set. Other data on the maps that were not automated include; elevation...
In the late 1880's and early 1900's the Mississippi River Commission (MRC) conducted an extensive high-resolution survey of the Mississippi River from Cairo, Illinois to Minneapolis, Minnesota. These data were published as a series of 89 survey maps and index. In the 1990's, the Upper Midwest Environmental Sciences Center (UMESC) in conjunction with the US Army Corps of Engineers Upper Mississippi River Restoration- Environmental Management Program -- Long Term Resource Monitoring Program element (LTRMP) for the Upper Mississippi River automated the maps' land cover/use symbology to create a turn of the century/pre-impoundment land cover/use data set. Other data on the maps that were not automated include; elevation...
Aerial photographs for Pools 1-13 Upper Mississippi River System and Pools, Alton-Marseilles, Illinois River were collected in color infrared (CIR) in August of 2010 at 8”/pixel and 16”/pixel respectively using a mapping-grade Applanix DSS 439 digital aerial camera. In August 2011, CIR aerial photographs for Pools 14-Open River South, Upper Mississippi River and Pools Dresden-Lockport, Illinois River were collected at 16”/pixel with the same camera. All CIR aerial photos were orthorectified, mosaicked, compressed, and served via the UMESC Internet site. The CIR aerial photos were interpreted and automated using a 31-class LTRMP vegetation classification. The 2010/11 LCU databases were prepared by or under the supervision...
Categories: Data;
Types: Downloadable,
Map Service,
OGC WFS Layer,
OGC WMS Layer,
OGC WMS Service,
Shapefile;
Tags: Aerial Photography,
Floodplain,
Floodplain Forest Mapping,
Floodplain Mapping,
LC/LU,
A digital representation of closed depression features overlying and adjacent to New York’s carbonate-bedrock aquifers. Includes closed depressions that are both natural and anthropogenic in origin. The features were derived from a digital contour database obtained from https://topotools.cr.usgs.gov/contour_data.php. The original contour dataset was generated from the National Elevation Dataset (NED) and the National Hydrography Dataset (NHD) in a fully automated process. The process is described in U.S. Geological Survey Scientific Investigations Report 2012–5167.
This EnviroAtlas web service supports research and online mapping activities related to EnviroAtlas (https://www.epa.gov/enviroatlas). The Food, Fuel, and Materials category in this web service includes layers illustrating the ecosystems and natural resources that provide or support the production of food, fuel, or other materials, the need or demand for these items, the impacts associated with their presence and accessibility, and factors that place stress on the natural environment's capability to provide these benefits. EnviroAtlas allows the user to interact with a web-based, easy-to-use, mapping application to view and analyze multiple ecosystem services for the conterminous United States. Additional descriptive...
This is the USGS Earth Resources and Science (EROS) Center catalog and repository space. This space primarily supports science projects by providing a place to organize and publicly release data that support science information products. The EROS Center studies land change and produces land change data products used by researchers, resource managers, and policy makers across the nation and around the world.
Disclaimer: this is an historic version of NLCD provided for research and citation purposes. Different release dates of NLCD cannot be used with other release dates for correct analysis. Each release of NLCD generates a complete set of directly comparable products. These products must be used together for correct analysis. You can find the latest suite of synced products at www.mrlc.gov. The National Land Cover Database 2001 land cover layer for mapping zones 01-66 was produced through a cooperative project conducted by the Multi-Resolution Land Characteristics (MRLC) Consortium. The MRLC Consortium is a partnership of federal agencies (www.mrlc.gov), consisting of the U.S. Geological Survey (USGS), the National...
Types: Map Service,
OGC WFS Layer,
OGC WMS Layer,
OGC WMS Service;
Tags: Base Maps,
Coastal Zone,
Earth Cover,
GIS,
Land Cover,
We mosaicked twelve LandSat-8 OLI satellite images taken during the summer of 2014, which were used in an object based image analysis (OBIA) to classify the landscape. We mapped seventeen of the most dominant geomorphic land cover classes on the Alaskan Coastal Plain (ACP): **value** | **class name** 1 | Coastal saline waters 2 | Large lakes 3 | Medium lakes 4 | Small lakes 5 | Ponds 6 | Rivers 7 | Nonpatterned Drained Thaw Lake Basins 8 | Coalescent low-center polygons 9 | Low-center polygons 10 | Flat-center polygons 11 | High-center polygons 12 | Drained slope 13 | Sandy barrens 14 | Sand dunes 15 | Riparian corridors 16 | Ice 17 | Urban (i.e. towns and roads)
Categories: Data;
Tags: Alaska CASC,
Data Visualization & Tools,
IEM,
IEM-Input,
Science Tools for Managers,
The National Land Cover Database (NLCD) is a land cover monitoring program providing land cover information for the United States. NLCD2016 extended temporal coverage to 15 years (2001–2016). We collected land cover reference data for the 2011 and 2016 nominal dates to report land cover accuracy for the NLCD2016 database 2011 and 2016 land cover components. We measured land cover accuracy at Level II and Level I, and change accuracy at Level I. For both the 2011 and 2016 land cover components, single-date Level II overall accuracies (OA) were 72% (standard error of ±0.9%) when agreement was defined as match between the map label and primary reference label only and 86% (± 0.7%) when agreement also included the alternate...
These raster datasets represent historical stand age. The last four digits of the file name specifies the year represented by the raster. For example a file named Age_years_historical_1990.tif represents the year 1990. Cell values represent the age of vegetation in years since last fire, with zero (0) indicating burned area in that year. Files from years 1860-2006 use a variety of historical datasets for Boreal ALFRESCO model spin up and calibration to most closely match historical wildfire dynamics.
These raster datasets represent historical stand age. The last four digits of the file name specifies the year represented by the raster. For example a file named Age_years_historical_1990.tif represents the year 1990. Cell values represent the age of vegetation in years since last fire, with zero (0) indicating burned area in that year. Files from years 1860-2006 use a variety of historical datasets for Boreal ALFRESCO model spin up and calibration to most closely match historical wildfire dynamics.
These raster datasets represent historical stand age. The last four digits of the file name specifies the year represented by the raster. For example a file named Age_years_historical_1990.tif represents the year 1990. Cell values represent the age of vegetation in years since last fire, with zero (0) indicating burned area in that year. Files from years 1860-2006 use a variety of historical datasets for Boreal ALFRESCO model spin up and calibration to most closely match historical wildfire dynamics.
The Integrated Ecosystem Model is designed to help resource managers understand the nature and expected rate of landscape change. Maps and other products generated by the IEM will illustrate how arctic and boreal landscapes are expected to alter due to climate-driven changes to vegetation, disturbance, hydrology, and permafrost. The products will also provide resource managers with an understanding of the uncertainty in the expected outcomes.
Potential Evapotranspiration (PET): These data represent decadal mean totals of potential evapotranspiration estimates (mm). The file name specifies the decade the raster represents. For example, a file named pet_mean_mm_decadal_MPI_ECHAM5_A1B_annual_2000-2009.tif represents the decade spanning 2000-2009. The data were generated by using the Hamon equation and output from ECHAM5, a fifth generation general circulation model created by the Max Planck Institute for Meteorology in Hamburg Germany. Data are at 2km x 2km resolution, and all data are stored in geotiffs. Calculations were performed using R 2.12.1 and 2.12.2 for Mac OS Leopard, and data were formatted into geotiffs using the raster and rgdal packages. Users...
This raster, created in 2010, is output from the Geophysical Institute Permafrost Lab (GIPL) model and represents simulated active layer thickness (ALT) in meters averaged across a decade. The file name specifies the decade the raster represents. For example, a file named ALT_1980_1989.tif represents the decade spanning 1980-1989. Cell values represent simulated maximum depth (in meters) of thaw penetration (for areas with permafrost) or frost penetration (for areas without permafrost). If the value of the cell is positive, the area is underlain by permafrost and the cell value specifies the depth of the seasonally thawing layer above permafrost. If the value of the cell is negative, the ground is only seasonally...
This pilot project has initiated a long-term integrated modeling project that aims todevelop a dynamically linked model framework focused on climate driven changes tovegetation, disturbance, hydrology, and permafrost, and their interactions and feedbacks.This pilot phase has developed a conceptual framework for linking current state-of-thesciencemodels of ecosystem processes in Alaska – ALFRESCO, TEM, GIPL-1 – and theprimary processes of vegetation, disturbance, hydrology, and permafrost that theysimulate. A framework that dynamically links these models has been defined and primaryinput datasets required by the models have been developed.
The USGS Forecasting Scenarios of Land-use Change (FORE-SCE) model was used to produce an agricultural biofuel scenarios for the Northern Glaciated Plains, from 2012 to 2030. The modeling used parcel data from the USDA's Common Land Unit (CLU) data set to represent real, contiguous ownership and land management units. A Monte Carlo approach was used to create 50 unique replicates of potential landscape conditions in the future, based on a agricultural scenario from the U.S. Department of Energy's Billion Ton Update. The data are spatially explicit, covering the entire Northern Glaciated Plains ecoregions (an EPA Level III ecoregion), with a spatial resolution of 30-meters and 22 unique land-cover classes (including...
Types: Citation,
Map Service,
OGC WFS Layer,
OGC WMS Layer,
OGC WMS Service;
Tags: FORE-SCE,
Great Plains,
Land Cover,
Minnesota,
Model,
This dataset is the third (circa 2013) in a series of three 1-kilometer land use land cover (LULC) time-periods datasets (1975, 2000, and 2013) aids in monitoring change in West Africa’s land resources. To monitor and map these changes, a 26 general LULC class system was used. The classification system that was developed was primarily inspired by the “Yangambi Classification” (Trochain, 1957). This fairly broad class system for LULC was used because the classes can be readily identified on Landsat satellite imagery. A visual photo-interpretation approach was used to identify and map the LULC classes represented on Landsat images. The Rapid Land Cover Mapper (RLCM) was used to facilitate the photo-interpretation...
Categories: Data;
Types: Downloadable,
GeoTIFF,
Map Service,
Raster;
Tags: Gambia,
Land Cover,
Land Use,
biota,
land cover,
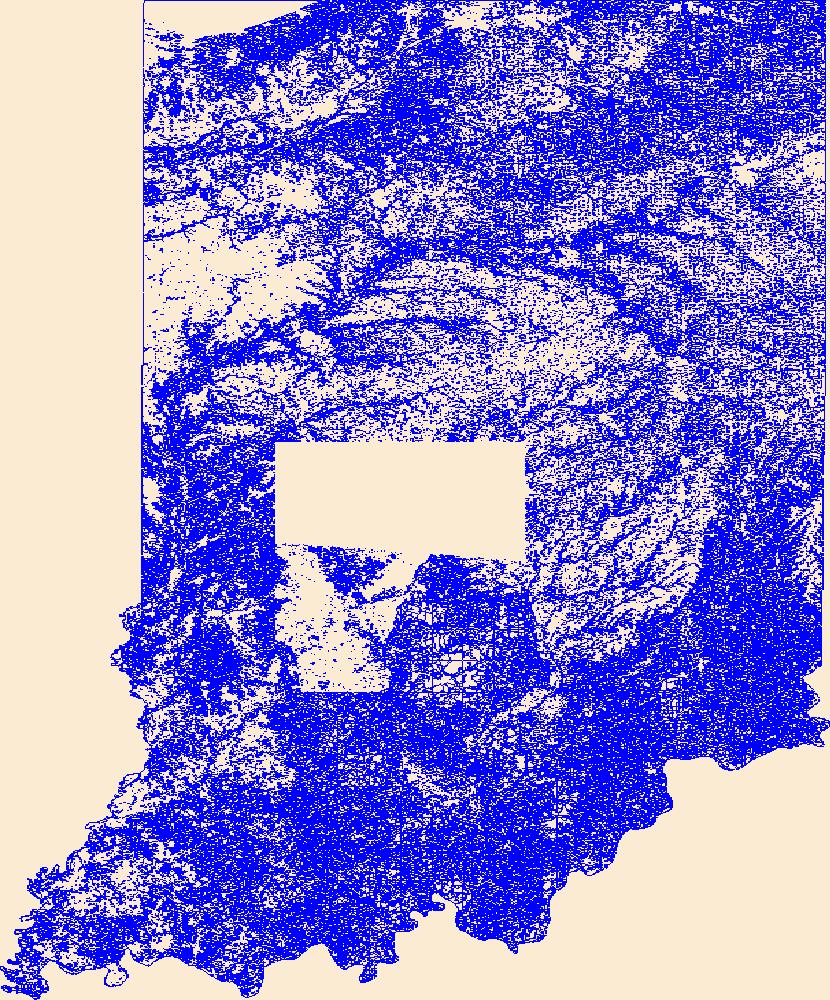
Geospatial data that is a derivative land cover product depicting woodland on topographic maps.
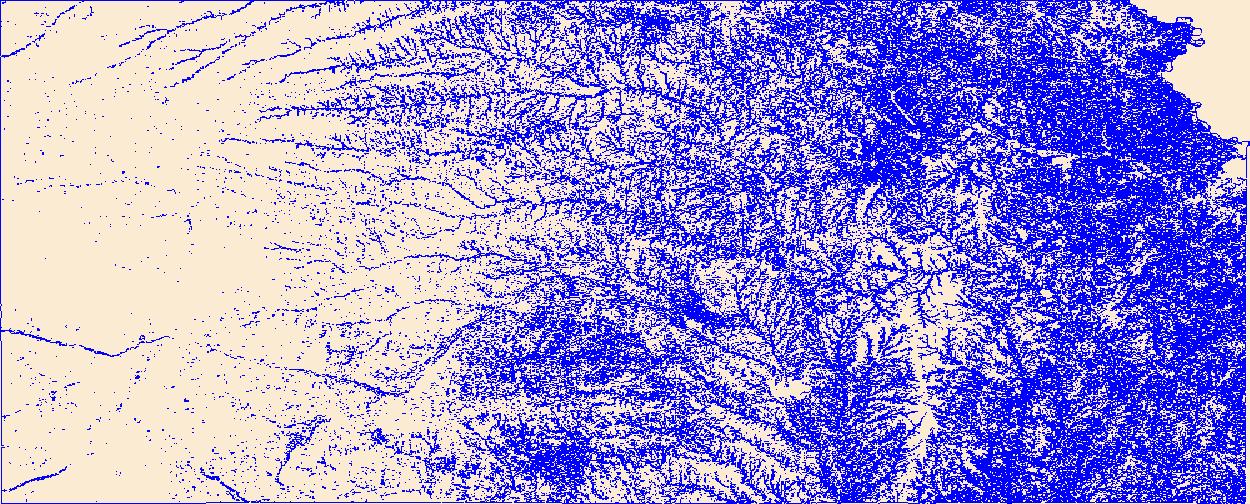
Geospatial data that is a derivative land cover product depicting woodland on topographic maps.
|

|
