Filters: Tags: Livingston County (X)
448 results (115ms)|
Filters
Date Range
Extensions Types Contacts
Categories Tag Types
|
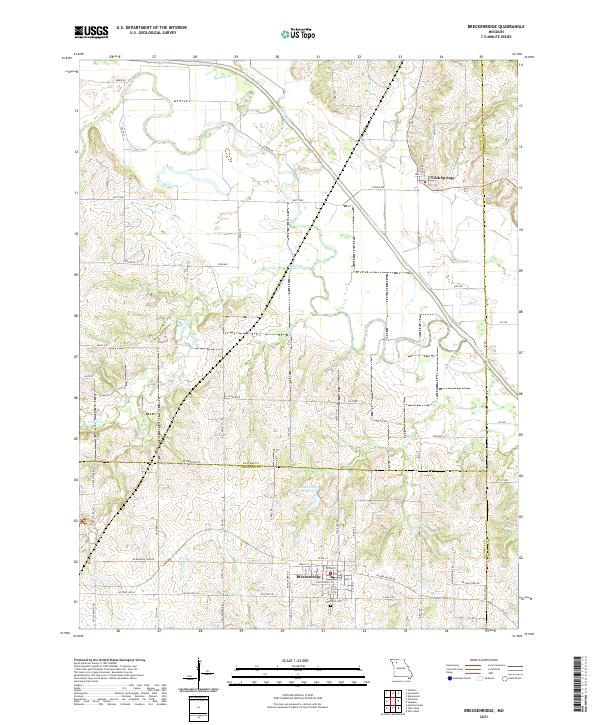
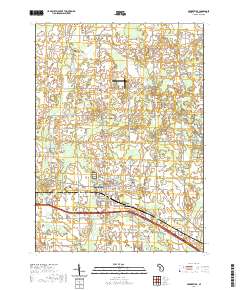
Layered geospatial PDF 7.5 Minute Quadrangle Map. Layers of geospatial data include orthoimagery, roads, grids, geographic names, elevation contours, hydrography, and other selected map features. This map is derived from GIS (geospatial information system) data. It represents a repackaging of GIS data in traditional map form, not creation of new information. The geospatial data in this map are from selected National Map data holdings and other government sources.
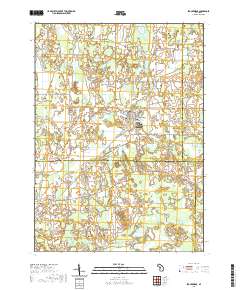
Layered geospatial PDF 7.5 Minute Quadrangle Map. Layers of geospatial data include orthoimagery, roads, grids, geographic names, elevation contours, hydrography, and other selected map features. This map is derived from GIS (geospatial information system) data. It represents a repackaging of GIS data in traditional map form, not creation of new information. The geospatial data in this map are from selected National Map data holdings and other government sources.
This folder contains the raw and processed TEM data and inverted soundings showing resistivity (in ohm-m) with depth for all survey sites that were part of transect 13. In October and November 2016-2017, transient electromagnetic (TEM) data, also called time domain electromagnetic (TDEM) surveys, were acquired at 120 locations in the Genesee Valley, Livingston County, in New York, in order to characterize the subsurface resistivity structure in support of a U.S. Geological Survey groundwater investigation. The TEM data were collected as part of a project to evaluate geophysical methods to characterize the valley-fill sediments, underlying bedrock, and salinity of the subsurface. TEM data were collected using an...
This folder contains the raw and processed TEM data and inverted soundings showing resistivity (in ohm-m) with depth for all survey sites that were part of transect 4. In October and November 2016-2017, transient electromagnetic (TEM) data, also called time domain electromagnetic (TDEM) surveys, were acquired at 120 locations in the Genesee Valley, Livingston County, in New York, in order to characterize the subsurface resistivity structure in support of a U.S. Geological Survey groundwater investigation. The TEM data were collected as part of a project to evaluate geophysical methods to characterize the valley-fill sediments, underlying bedrock, and salinity of the subsurface. TEM data were collected using an ABEM...
This page contains horizontal-to-vertical spectral ratio (HVSR) data for 86 measurements, LVHVSR1 through LVHVSR97. In October and November of 2016 and 2017, the U.S. Geological Survey collected horizontal-to-vertical spectral ratio (HVSR) data at 104 sites in the Genesee Valley, Livingston County, New York as part of a saline-groundwater investigation in cooperation with the New York State Department of Environmental Resources. The HVSR technique, commonly referred to as the passive-seismic method, is used to estimate the thickness of unconsolidated sediments and the depth to bedrock (Lane and others, 2008). The passive-seismic method uses a single, broad-band three-component (two horizontal and one vertical)...
This folder contains the raw and processed TEM data and inverted soundings showing resistivity (in ohm-m) with depth for all survey sites that were part of transect 9. In October and November 2016-2017, transient electromagnetic (TEM) data, also called time domain electromagnetic (TDEM) surveys, were acquired at 120 locations in the Genesee Valley, Livingston County, in New York, in order to characterize the subsurface resistivity structure in support of a U.S. Geological Survey groundwater investigation. The TEM data were collected as part of a project to evaluate geophysical methods to characterize the valley-fill sediments, underlying bedrock, and salinity of the subsurface. TEM data were collected using an ABEM...
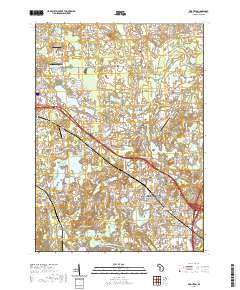
Layered geospatial PDF 7.5 Minute Quadrangle Map. Layers of geospatial data include orthoimagery, roads, grids, geographic names, elevation contours, hydrography, and other selected map features. This map is derived from GIS (geospatial information system) data. It represents a repackaging of GIS data in traditional map form, not creation of new information. The geospatial data in this map are from selected National Map data holdings and other government sources.
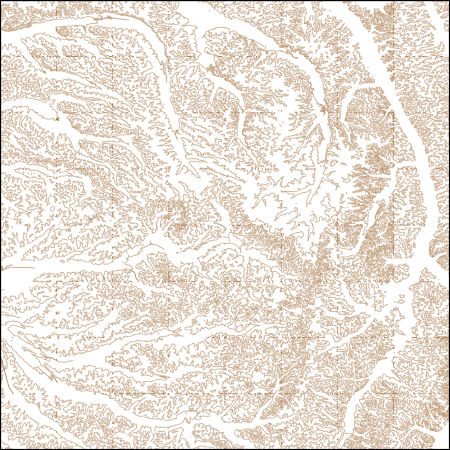
These vector contour lines are derived from the 3D Elevation Program using automated and semi-automated processes. They were created to support 1:24,000-scale CONUS and Hawaii, 1:25,000-scale Alaska, and 1:20,000-scale Puerto Rico / US Virgin Island topographic map products, but are also published in this GIS vector format. Contour intervals are assigned by 7.5-minute quadrangle, so this vector dataset is not visually seamless across quadrangle boundaries. The vector lines have elevation attributes (in feet above mean sea level on NAVD88), but this dataset does not carry line symbols or annotation.
Layers of geospatial data include contours, boundaries, land cover, hydrography, roads, transportation, geographic names, structures, and other selected map features.
Layers of geospatial data include contours, boundaries, land cover, hydrography, roads, transportation, geographic names, structures, and other selected map features.
Layers of geospatial data include contours, boundaries, land cover, hydrography, roads, transportation, geographic names, structures, and other selected map features.
Types: Citation;
Tags: 7.5 x 7.5 minute,
7_5_Min,
Combined Vector,
Combined Vector,
Combined Vector,

Layers of geospatial data include contours, boundaries, land cover, hydrography, roads, transportation, geographic names, structures, and other selected map features.
Types: Citation;
Tags: 7.5 x 7.5 minute,
7_5_Min,
Combined Vector,
Combined Vector,
Combined Vector,
Background: A sequence of gently dipping carbonate bedrock - the Bertie Formation, Akron Dolostone, and Onondaga Limestone crop out along a 2- to5-mile wide band in western and central New York. These bedrock units trend east-west for 250 miles across the State and form extensive carbonate-bedrock aquifers which transmit and yield water from solution-enlarged fractures, bedding planes, and other openings (Olcott, 1995). Bedding planes or sub-horizontal fractures typically are the most enlarged and important water conduits. Karstic features such as sinkholes, swallets, solution channels, and caverns can locally transmit large amounts of surface water into the ground where the groundwater can move quickly and over...
Categories: Data,
Project;
Types: Downloadable,
Map Service,
OGC WFS Layer,
OGC WMS Layer,
Shapefile;
Tags: Aquifer Mapping,
Aquifer Mapping,
Aquifer Mapping,
Basin & Hydrogeologic Characterization,
Basin & Hydrogeologic Characterization,
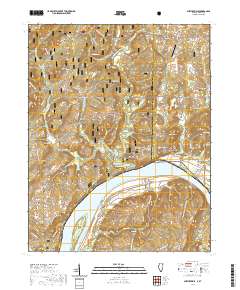
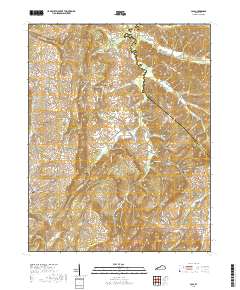
Layered geospatial PDF 7.5 Minute Quadrangle Map. Layers of geospatial data include orthoimagery, roads, grids, geographic names, elevation contours, hydrography, and other selected map features. This map is derived from GIS (geospatial information system) data. It represents a repackaging of GIS data in traditional map form, not creation of new information. The geospatial data in this map are from selected National Map data holdings and other government sources.
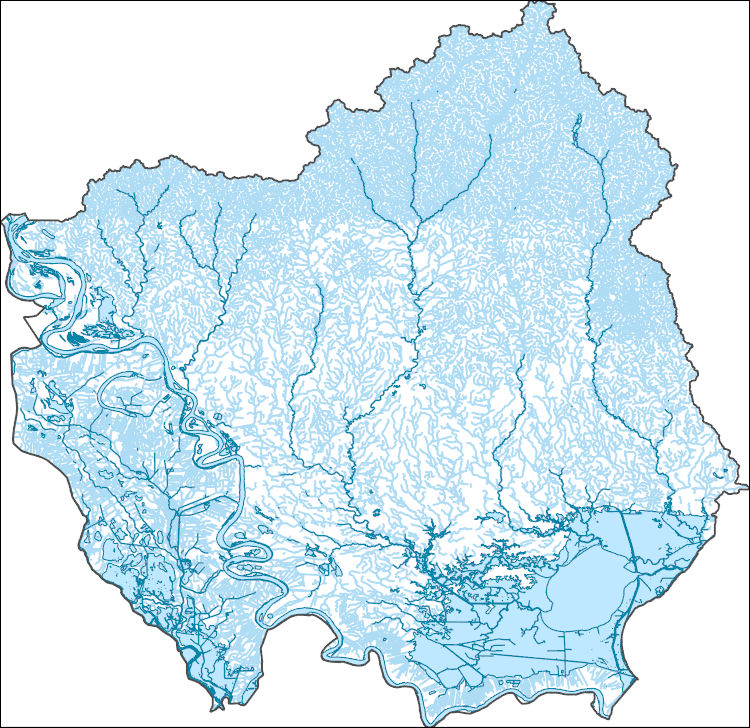
The High Resolution National Hydrography Dataset Plus (NHDPlus HR) is an integrated set of geospatial data layers, including the best available National Hydrography Dataset (NHD), the 10-meter 3D Elevation Program Digital Elevation Model (3DEP DEM), and the National Watershed Boundary Dataset (WBD). The NHDPlus HR combines the NHD, 3DEP DEMs, and WBD to create a stream network with linear referencing, feature naming, "value added attributes" (VAAs), elevation-derived catchments, and other features for hydrologic data analysis. The stream network with linear referencing is a system of data relationships applied to hydrographic systems so that one stream reach "flows" into another and "events" can be tied to and traced...
Layered geospatial PDF 7.5 Minute Quadrangle Map. Layers of geospatial data include orthoimagery, roads, grids, geographic names, elevation contours, hydrography, and other selected map features. This map is derived from GIS (geospatial information system) data. It represents a repackaging of GIS data in traditional map form, not creation of new information. The geospatial data in this map are from selected National Map data holdings and other government sources.
Layered geospatial PDF 7.5 Minute Quadrangle Map. Layers of geospatial data include orthoimagery, roads, grids, geographic names, elevation contours, hydrography, and other selected map features. This map is derived from GIS (geospatial information system) data. It represents a repackaging of GIS data in traditional map form, not creation of new information. The geospatial data in this map are from selected National Map data holdings and other government sources.
Layered geospatial PDF 7.5 Minute Quadrangle Map. Layers of geospatial data include orthoimagery, roads, grids, geographic names, elevation contours, hydrography, and other selected map features. This map is derived from GIS (geospatial information system) data. It represents a repackaging of GIS data in traditional map form, not creation of new information. The geospatial data in this map are from selected National Map data holdings and other government sources.
Layered geospatial PDF 7.5 Minute Quadrangle Map. Layers of geospatial data include orthoimagery, roads, grids, geographic names, elevation contours, hydrography, and other selected map features. This map is derived from GIS (geospatial information system) data. It represents a repackaging of GIS data in traditional map form, not creation of new information. The geospatial data in this map are from selected National Map data holdings and other government sources.
Using publicly available data for Livingston and Monroe counties, New York, a series of geospatial overlays were created at 1:24,000 scale to examine the bedrock geology, groundwater table, soils, and surficial geology. Bedrock and surficial geology were refined using extant bedrock maps, well and borehole data from water- and gas-wells, soil data, and lidar data. Groundwater data were collected from New York State Department of Environmental Conservation and U.S. Geological Survey water-well databases to estimate the groundwater table. Soil data were used to examine soil thickness over bedrock and infiltration. An inventory of closed depressions was created using reconditioned lidar-derived bare-earth digital...
|

|
