Filters: Tags: Mammal (X) > partyWithName: Conservation Biology Institute (X)
49 results (26ms)|
Filters
Date Range
Tag Schemes |

Future (2046-2065) predicted probability of fisher year-round occurrence projected under the A1fi emissions scenario with the Hadley CM3 GCM model (Gordon et al. 2000, Pope et al. 2000). Projected fisher distribution was created with Maxent (Phillips et al. 2006) using fisher detections (N = 102, spanning 1993 – 2011) and seven predictor variables: mean winter (January – March) precipitation, mean summer (July – September) precipitation, mean summer temperature amplitude, mean daily low temperature for the month of the year with the warmest mean daily low temperature, mean fraction of vegetation carbon burned, mean vegetation carbon (g C m2), and modal vegetation class. Predictor variables had a grid cell size of...
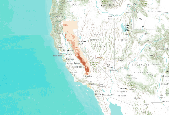
Description: Predicted probability of fisher year-round occurrence created with Maxent (Phillips et al. 2006) using fisher detections (N = 102, spanning 1993 – 2011) and seven predictor variables: mean winter (January – March) precipitation, mean summer (July – September) precipitation, mean summer temperature amplitude, mean daily low temperature for the month of the year with the warmest mean daily low temperature, mean fraction of vegetation carbon burned, mean vegetation carbon (g C m2), and modal vegetation class. Predictor variables had a grid cell size of 10 km, vegetation variables were simulated with MC1 (Hayhoe et al. 2004) and climate variables were provided by the PRISM GROUP (Daly et al. 1994). This...

Predicted probability of marten year-round occurrence derived from future (2076-2095) climate projections and vegetation simulations. Projected marten distribution was created with Maxent (Phillips et al. 2006) using marten detections (N = 102, spanning 1993 – 2011) and eight predictor variables: mean potential evapotranspiration, mean annual precipitation, mean fraction of vegetation carbon burned, mean forest carbon (g C m2), mean fraction of vegetation carbon in forest, understory index (fraction of grass vegetation carbon in forest), average maximum tree LAI, and modal vegetation class. Future climate drivers were generated using statistical downscaling (simple delta method) of general circulation model projections,...

Agreement in predicted marten year-round distribution derived from future (2046-2065) climate projections and vegetation simulations using 3 GCMs (Hadley CM3 (Johns et al. 2003), MIROC (Hasumi and Emori 2004), and CSIRO Mk3 (Gordon 2002)) under the A2 emissions scenario (Naki?enovi? et al. 2000). Projected marten distribution was created with Maxent (Phillips et al. 2006) using marten detections (N = 302, spanning 1990 – 2011) and eight predictor variables: mean potential evapotranspiration, mean annual precipitation, mean fraction of vegetation carbon burned, mean forest carbon (g C m2), mean fraction of vegetation carbon in forest, understory index (fraction of grass vegetation carbon in forest), average maximum...

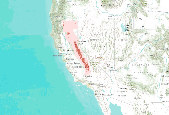
Predicted probability of fisher year-round occurrence created with Maxent (Phillips et al. 2006) using fisher detections (N = 302, spanning 1990 – 2011) and five predictor variables: mean annual precipitation, mean summer (July – September) precipitation, mean understory index (fraction of grass vegetation carbon in forest), mean forest carbon (g C m2), and mean fraction of vegetation carbon in forest. Predictor variables had a grid cell size of 800 m by 800 m, vegetation variables were simulated with MC1 dynamic global vegetation model (Bachelet et al. 2001) and historical climate variables were provided by the PRISM GROUP (Daly et al. 2008). This fisher distribution model has a 10-fold cross-validated AUC of...
Future (2076-2095) predicted probability of marten year-round occurrence projected under the A2 emissions scenario with the PCM1 GCM (Washington et al. 2000; Meehl et al. 2003). The projected marten distribution was created with Maxent (Phillips et al. 2006) using marten detections (N = 302, spanning 1990 – 2011) and nine predictor variables: mean annual precipitation, mean summer (July – September) precipitation, mean summer temperature amplitude, mean annual temperature maximum, mean fraction of vegetation carbon burned, mean understory index, mean vegetation carbon (g C m2), modal vegetation class, and average maximum tree LAI. Predictor variables had a grid cell size of 10 km, vegetation variables were simulated...

Predicted probability of fisher winter occurrence created with Maxent (Phillips et al. 2006) using fisher detections (N = 33, December – April, spanning 1995 – 2011) and eight predictor variables: mean winter (January – March) precipitation, mean winter (January – March) minimum temperature, mean fraction of vegetation carbon burned, mean understory index (fraction of grass vegetation carbon in forest), mean fraction of total forest carbon in coarse wood carbon, mean forest carbon (g C m2), mean fraction of vegetation carbon in forest, and modal vegetation class. Predictor variables had a grid cell size of 4 km by 4 km, vegetation variables were simulated by the MC1 dynamic global vegetation model (Bachelet et al....

Predicted probability of marten year-round occurrence derived from future (2076-2095) climate projections and vegetation simulations. Projected marten distribution was created with Maxent (Phillips et al. 2006) using marten detections (N = 302, spanning 1990 – 2011) and nine predictor variables: mean winter (January – March) precipitation, mean amount of snow on the ground in March, mean understory index (fraction of grass vegetation carbon in forest), mean fraction of total forest carbon in coarse wood carbon, average maximum tree LAI, mean fraction of vegetation carbon burned, mean forest carbon (g C m2), mean fraction of vegetation carbon in forest, and modal vegetation class. Future climate drivers were...

Agreement in predicted marten year-round distribution derived from future (2046-2065) climate projections and vegetation simulations using 2 GCMs (Hadley CM3 (Johns et al. 2003) and MIROC (Hasumi and Emori 2004)) under the A2 emissions scenario (Naki?enovi? et al. 2000). Projected marten distribution was created with Maxent (Phillips et al. 2006) using marten detections (N = 302, spanning 1990 – 2011) and nine predictor variables: mean winter (January – March) precipitation, mean amount of snow on the ground in March, mean understory index (fraction of grass vegetation carbon in forest), mean fraction of total forest carbon in coarse wood carbon, average maximum tree LAI, mean fraction of vegetation carbon burned,...

Predicted probability of marten year-round occurrence derived from future (2046-2065) climate projections and vegetation simulations. Projected marten distribution was created with Maxent (Phillips et al. 2006) using marten detections (N = 302, spanning 1990 – 2011) and nine predictor variables: mean winter (January – March) precipitation, mean amount of snow on the ground in March, mean understory index (fraction of grass vegetation carbon in forest), mean fraction of total forest carbon in coarse wood carbon, average maximum tree LAI, mean fraction of vegetation carbon burned, mean forest carbon (g C m2), mean fraction of vegetation carbon in forest, and modal vegetation class. Future climate drivers were...

Predicted probability of fisher year-round occurrence derived from future (2046-2065) climate projections and vegetation simulations. Projected fisher distribution was created with Maxent (Phillips et al. 2006) using fisher detections (N = 302, spanning 1990 – 2011) and five predictor variables: mean annual precipitation, mean summer (July – September) precipitation, mean understory index (fraction of grass vegetation carbon in forest), mean forest carbon (g C m2), and mean fraction of vegetation carbon in forest. Future climate drivers were generated using statistical downscaling (simple delta method) of general circulation model projections, in this case CSIRO Mk3 (Gordon 2002) under the A2 emission scenario...

Predicted probability of marten year-round occurrence derived from future (2046-2065) climate projections and vegetation simulations. Projected marten distribution was created with Maxent (Phillips et al. 2006) using marten detections (N = 302, spanning 1990 – 2011) and nine predictor variables: mean winter (January – March) precipitation, mean amount of snow on the ground in March, mean understory index (fraction of grass vegetation carbon in forest), mean fraction of total forest carbon in coarse wood carbon, average maximum tree LAI, mean fraction of vegetation carbon burned, mean forest carbon (g C m2), mean fraction of vegetation carbon in forest, and modal vegetation class. Future climate drivers were...

Predicted probability of marten year-round occurrence created with Maxent (Phillips et al. 2006) using marten detections (N = 302, spanning 1990 – 2011) and nine predictor variables: mean winter (January – March) precipitation, mean amount of snow on the ground in March, mean understory index (fraction of grass vegetation carbon in forest), mean fraction of total forest carbon in coarse wood carbon, average maximum tree LAI, mean fraction of vegetation carbon burned, mean forest carbon (g C m2), mean fraction of vegetation carbon in forest, and modal vegetation class. Predictor variables had a grid cell size of 4 km by 4 km, vegetation variables were simulated with MC1 dynamic global vegetation model (Bachelet...

Predicted probability of marten year-round occurrence created with Maxent (Phillips et al. 2006) using marten detections (N = 302, spanning 1990 – 2011) and eight predictor variables: mean annual precipitation, mean summer (July – September) precipitation, mean summer temperature amplitude, mean annual temperature maximum, mean fraction of vegetation carbon burned, mean understory index, mean vegetation carbon (g C m-2), and modal vegetation class. Predictor variables had a grid cell size of 10 km, vegetation variables were simulated with MC1 (Hayhoe et al. 2004), historical climate variables were provided by the PRISM GROUP (Daly et al. 1994), and future climate projections were obtained from the Hadley Center...

Predicted probability of fisher summer occurrence created with Maxent (Phillips et al. 2006) using fisher detections (N = 83, May – November, spanning 1993 – 2009) and eight predictor variables: mean annual precipitation, mean summer (July – September) precipitation, mean summer temperature amplitude, mean understory index (fraction of grass vegetation carbon in forest), mean fraction of total forest carbon in coarse wood carbon, mean forest carbon (g C m2), mean fraction of vegetation carbon in forest, and modal vegetation class. Predictor variables had a grid cell size of 4 km by 4 km, vegetation variables were simulated by the MC1 dynamic global vegetation model (Bachelet et al. 2001) and historical climate variables...

Predicted probability of fisher year-round occurrence created with Maxent (Phillips et al. 2006) using fisher detections (N = 102, spanning 1993 – 2011) and nine predictor variables: mean winter (January – March) precipitation, mean summer (July – September) precipitation, mean summer temperature amplitude, mean daily low temperature for the month of the year with the warmest mean daily low temperature, average number of months with mean temperature < 0°C, mean understory index (fraction of grass vegetation carbon in forest), mean fraction of total forest carbon in coarse wood carbon, mean forest carbon (g C m2), mean fraction of vegetation carbon in forest, and modal vegetation class. Predictor variables had a...

Future (2046-2065) predicted probability of marten year-round occurrence projected under the A2 emissions scenario with the PCM1 GCM (Washington et al. 2000; Meehl et al. 2003). The projected marten distribution was created with Maxent (Phillips et al. 2006) using marten detections (N = 302, spanning 1990 – 2011) and nine predictor variables: mean annual precipitation, mean summer (July – September) precipitation, mean summer temperature amplitude, mean annual temperature maximum, mean fraction of vegetation carbon burned, mean understory index, mean vegetation carbon (g C m2), modal vegetation class, and average maximum tree LAI. Predictor variables had a grid cell size of 10 km, vegetation variables were simulated...

Predicted probability of fisher year-round occurrence derived from future (2046-2065) climate projections and vegetation simulations. Projected fisher distribution was created with Maxent (Phillips et al. 2006) using fisher detections (N = 302, spanning 1990 – 2011) and five predictor variables: mean annual precipitation, mean summer (July – September) precipitation, mean understory index (fraction of grass vegetation carbon in forest), mean forest carbon (g C m2), and mean fraction of vegetation carbon in forest. Future climate drivers were generated using statistical downscaling (simple delta method) of general circulation model projections, in this case Hadley CM3 (Johns et al. 2003) under the A2 emission scenario...

This data set contains sensitive biological resource data for sea otters, sea lions, and harbor seals in Puget Sound and Strait of Juan de Fuca, Washington. Vector points in this data set represent seal and sea lion haulout sites, as well as observed sea otter concentrations. Species-specific abundance, seasonality, status, life history, and source information are stored in relational data tables (described below) designed to be used in conjunction with this spatial data layer. This data set comprises a portion of the Environmental Sensitivity Index (ESI) data for Puget Sound and Strait of Juan de Fuca, Washington. ESI data characterize the marine and coastal environments and wildlife by their sensitivity to spilled...

Agreement in predicted marten year-round distribution derived from future (2076-2095) climate projections and vegetation simulations using 3 GCMs (Hadley CM3 (Johns et al. 2003), MIROC (Hasumi and Emori 2004), and CSIRO Mk3 (Gordon 2002)) under the A2 emissions scenario (Naki?enovi? et al. 2000). Projected marten distribution was created with Maxent (Phillips et al. 2006) using marten detections (N = 302, spanning 1990 – 2011) and eight predictor variables: mean potential evapotranspiration, mean annual precipitation, mean fraction of vegetation carbon burned, mean forest carbon (g C m2), mean fraction of vegetation carbon in forest, understory index (fraction of grass vegetation carbon in forest), average maximum...
|

|
