Filters: Tags: Mammal (X)
118 results (60ms)|
Filters
Contacts
(Less)
|

Future (2046-2065) predicted probability of fisher year-round occurrence projected under the A1fi emissions scenario with the Hadley CM3 GCM model (Gordon et al. 2000, Pope et al. 2000). Projected fisher distribution was created with Maxent (Phillips et al. 2006) using fisher detections (N = 102, spanning 1993 – 2011) and seven predictor variables: mean winter (January – March) precipitation, mean summer (July – September) precipitation, mean summer temperature amplitude, mean daily low temperature for the month of the year with the warmest mean daily low temperature, mean fraction of vegetation carbon burned, mean vegetation carbon (g C m2), and modal vegetation class. Predictor variables had a grid cell size of...
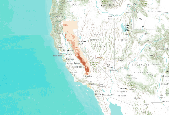
Description: Predicted probability of fisher year-round occurrence created with Maxent (Phillips et al. 2006) using fisher detections (N = 102, spanning 1993 – 2011) and seven predictor variables: mean winter (January – March) precipitation, mean summer (July – September) precipitation, mean summer temperature amplitude, mean daily low temperature for the month of the year with the warmest mean daily low temperature, mean fraction of vegetation carbon burned, mean vegetation carbon (g C m2), and modal vegetation class. Predictor variables had a grid cell size of 10 km, vegetation variables were simulated with MC1 (Hayhoe et al. 2004) and climate variables were provided by the PRISM GROUP (Daly et al. 1994). This...

Predicted probability of marten year-round occurrence derived from future (2076-2095) climate projections and vegetation simulations. Projected marten distribution was created with Maxent (Phillips et al. 2006) using marten detections (N = 102, spanning 1993 – 2011) and eight predictor variables: mean potential evapotranspiration, mean annual precipitation, mean fraction of vegetation carbon burned, mean forest carbon (g C m2), mean fraction of vegetation carbon in forest, understory index (fraction of grass vegetation carbon in forest), average maximum tree LAI, and modal vegetation class. Future climate drivers were generated using statistical downscaling (simple delta method) of general circulation model projections,...

Agreement in predicted marten year-round distribution derived from future (2046-2065) climate projections and vegetation simulations using 3 GCMs (Hadley CM3 (Johns et al. 2003), MIROC (Hasumi and Emori 2004), and CSIRO Mk3 (Gordon 2002)) under the A2 emissions scenario (Naki?enovi? et al. 2000). Projected marten distribution was created with Maxent (Phillips et al. 2006) using marten detections (N = 302, spanning 1990 – 2011) and eight predictor variables: mean potential evapotranspiration, mean annual precipitation, mean fraction of vegetation carbon burned, mean forest carbon (g C m2), mean fraction of vegetation carbon in forest, understory index (fraction of grass vegetation carbon in forest), average maximum...
Some of the SNK rasters intentionally do not align or have the same extent. These rasters were not snapped to a common raster per the authors' discretion. Please review selected rasters prior to use. These varying alignments are a result of the use of differing source data sets and all products derived from them. We recommend that users snap or align rasters as best suits their own projects. - This dataset consists of raster distribution maps for terrestrial vertebrate species in Alaska. Individual species distribution maps were developed using the best available known occurrence points for each species and modeled using MaxEnt software and a series of environmental predictor variables. Output maps were clipped...
In addition to current distribution of each mammal species, this map shows their current and near-term status within the ecoregion. Current, long-term, and summary bioclimate data is also include for several of these mammal species. The input datasets used in the distribution model are also included. These data are provided by Bureau of Land Management (BLM) "as is" and may contain errors or omissions. The User assumes the entire risk associated with its use of these data and bears all responsibility in determining whether these data are fit for the User's intended use. These data may not have the accuracy, resolution, completeness, timeliness, or other characteristics appropriate for applications that potential...
In addition to current distribution of each mammal species, this map shows their current and near-term status within the ecoregion. Current, long-term, and summary bioclimate data is also include for several of these mammal species. The input datasets used in the distribution model are also included. These data are provided by Bureau of Land Management (BLM) "as is" and may contain errors or omissions. The User assumes the entire risk associated with its use of these data and bears all responsibility in determining whether these data are fit for the User's intended use. These data may not have the accuracy, resolution, completeness, timeliness, or other characteristics appropriate for applications that potential...
In addition to current distribution of each mammal species, this map shows their current and near-term status within the ecoregion. Current, long-term, and summary bioclimate data is also include for several of these mammal species. The input datasets used in the distribution model are also included. These data are provided by Bureau of Land Management (BLM) "as is" and may contain errors or omissions. The User assumes the entire risk associated with its use of these data and bears all responsibility in determining whether these data are fit for the User's intended use. These data may not have the accuracy, resolution, completeness, timeliness, or other characteristics appropriate for applications that potential...
GIS layers showing current and future connectivity for pine snake, eastern diamondback rattlesnake, eastern couger, red wolf, and black bear
Categories: Data;
Tags: Climate change,
Completed,
Data,
Data.gov South Atlantic Landscape Conservation Cooperative,
Datasets/Database,
Grasslands comprise a small part of the Chihuahuan Desert but are vital to the biological diversity of the ecoregion. Characteristic grasses of the Chihuahuan Desert are tobosa (Pleuraphis mutica) and black grama (Bouteloua eriopoda) but other common species include alakali sacaton (Sporobolus airoides), big alkali sacaton (S. wrightii), mesa dropseed (S. flexuosus), blue grama (B. gracilis), sideoats grama (B. curtipendula ), hairy grama (B. hirsuta), slender grama (B. filiformis), chino grama (B. brevista), spruce top grama (B. chondrosioides), bush muhly (Muhlenbergia porteri), several three awns (Aristida spp.), and fluff grass (Dasyochloa pulchela) (Johnson 1974, Dinerstein et al. 2000). Many of the sites discussed...
Categories: Publication;
Types: Citation,
Map Service,
OGC WFS Layer,
OGC WMS Layer,
OGC WMS Service;
Tags: English,
Madrean,
Spanish,
agriculture,
assessment,
The Desert Renewable Energy Conservation Plan (DRECP), a major component of California's renewable energy planning efforts, will help provide effective protection and conservation of desert ecosystems while allowing for the appropriate development of renewable energy projects. The DRECP is focused on the desert regions and adjacent lands of seven California counties - Imperial, Inyo, Kern, Los Angeles, Riverside, San Bernardino, and San Diego. It is being prepared through an unprecedented collaborative effort between the California Energy Commission, California Department of Fish and Wildlife, the U.S. Bureau of Land Management, and the U.S. Fish and Wildlife Service also known as the Renewable Energy Action Team....
Categories: Publication;
Types: Citation,
Map Service,
OGC WFS Layer,
OGC WMS Layer,
OGC WMS Service;
Tags: English,
GIS,
OHV,
US,
bird,
What are current conditions for important park natural resources? What are the critical data and knowledge gaps? What are some of the factors that are influencing park resource conditions? Natural Resource Condition Assessments (NRCAs) evaluate and report on the above for a subset of important natural resources in national park units (hereafter, parks). Focal study resources and indicators are selected on a park-by-park basis, guided by use of structured resource assessment and reporting frameworks. Considerations include park resource setting and enabling legislation (what are this park's most important natural resources?) and presently available data and expertise (what can be evaluated at this time?). In addition...
Categories: Data;
Types: ArcGIS REST Map Service,
Map Service,
OGC WFS Layer,
OGC WMS Layer,
OGC WMS Service;
Tags: Chihuahuan Desert,
English,
GIS,
Madrean,
Mojave Desert,
Natural landscapes in the Southwestern United States are changing. In recent decades, rising temperatures and drought have led to drier conditions, contributed to large-scale ecological impacts, and affected many plant and animal species across the region. The current and future trajectory of climate change underscores the need for managers and conservation professionals to understand the impacts of these patterns on natural resources. In this regional assessment of the Southwest Climate Change Initiative, we evaluate changes in annual average temperatures from 1951–2006 across major habitats and large watersheds and compare these changes to the number of species of conservation concern that are found within these...
Categories: Publication;
Types: Citation,
Map Service,
OGC WFS Layer,
OGC WMS Layer,
OGC WMS Service;
Tags: Chihuahuan Desert,
English,
Madrean,
Mojave Desert,
Sonoran Desert,
Welcome to the Wind and Wildlife Landscape Assessment Tool (LAT), a collaboration organized by the American Wind Wildlife Institute (AWWI) and The Nature Conservancy (TNC). The LAT is designed as a landscape-level planning tool to identify sensitive wildlife habitat and areas that are likely to have low wildlife risk where wind energy development could be prioritized. Although the siting of individual wind energy projects will require on-the-ground surveys to verify data shown here, our hope is that this tool will provide stakeholders with information that facilitates the siting of wind energy in areas with minimal impacts to wildlife, as well as the development of conservation plans, monitoring plans and mitigation...
Types: Map Service,
OGC WFS Layer,
OGC WMS Layer,
OGC WMS Service;
Tags: English,
GIS,
US,
agriculture,
amphibian,
The Coordinating Institution for the Species and Specimens Thematic Network is a Consortium leads by "Instituto Nacional de Biodiversidad, INBio of Costa Rica" . The members of the consortrium are: Instituto Nacional de Biodiversidad, INBio (Costa Rica) Instituto de Investigación de Recursos Biológicos Alexander von Humboldt (Colombia) (Colombia) Museo Argentino de Ciencias Naturales (Argentina) Red de Herbarios de Centroamérica y el Caribe Natureserve (USA) The goal is to implement an electronic and institutional network dedicated to regional specimen information. Some of the specimen data of any given country resides in its own museums and herbariums, although a significant part of the data resides in museums...
Types: Map Service,
OGC WFS Layer,
OGC WMS Layer,
OGC WMS Service;
Tags: GIS,
Mexico,
amphibian,
bird,
fish,

Predicted probability of fisher winter occurrence created with Maxent (Phillips et al. 2006) using fisher detections (N = 33, December – April, spanning 1995 – 2011) and eight predictor variables: mean winter (January – March) precipitation, mean winter (January – March) minimum temperature, mean fraction of vegetation carbon burned, mean understory index (fraction of grass vegetation carbon in forest), mean fraction of total forest carbon in coarse wood carbon, mean forest carbon (g C m2), mean fraction of vegetation carbon in forest, and modal vegetation class. Predictor variables had a grid cell size of 4 km by 4 km, vegetation variables were simulated by the MC1 dynamic global vegetation model (Bachelet et al....

Predicted probability of marten year-round occurrence derived from future (2076-2095) climate projections and vegetation simulations. Projected marten distribution was created with Maxent (Phillips et al. 2006) using marten detections (N = 302, spanning 1990 – 2011) and nine predictor variables: mean winter (January – March) precipitation, mean amount of snow on the ground in March, mean understory index (fraction of grass vegetation carbon in forest), mean fraction of total forest carbon in coarse wood carbon, average maximum tree LAI, mean fraction of vegetation carbon burned, mean forest carbon (g C m2), mean fraction of vegetation carbon in forest, and modal vegetation class. Future climate drivers were...

Agreement in predicted marten year-round distribution derived from future (2046-2065) climate projections and vegetation simulations using 2 GCMs (Hadley CM3 (Johns et al. 2003) and MIROC (Hasumi and Emori 2004)) under the A2 emissions scenario (Naki?enovi? et al. 2000). Projected marten distribution was created with Maxent (Phillips et al. 2006) using marten detections (N = 302, spanning 1990 – 2011) and nine predictor variables: mean winter (January – March) precipitation, mean amount of snow on the ground in March, mean understory index (fraction of grass vegetation carbon in forest), mean fraction of total forest carbon in coarse wood carbon, average maximum tree LAI, mean fraction of vegetation carbon burned,...

Predicted probability of marten year-round occurrence derived from future (2046-2065) climate projections and vegetation simulations. Projected marten distribution was created with Maxent (Phillips et al. 2006) using marten detections (N = 302, spanning 1990 – 2011) and nine predictor variables: mean winter (January – March) precipitation, mean amount of snow on the ground in March, mean understory index (fraction of grass vegetation carbon in forest), mean fraction of total forest carbon in coarse wood carbon, average maximum tree LAI, mean fraction of vegetation carbon burned, mean forest carbon (g C m2), mean fraction of vegetation carbon in forest, and modal vegetation class. Future climate drivers were...
The Sevilleta LTER supports a long-term, integrated, interdisciplinary research program addressing key hypotheses on pattern and process in aridland ecosystems. Sevilleta LTER research includes studies in desert grassland and shrubland communities, and riparian and mountain forests emphasizing pulse driven processes in space and time. Key drivers (e.g., climate, fire, water, resource availability) govern dynamics in each landscape component. Our focus on how biotic and abiotic drivers affect spatial and temporal dynamics of aridland ecosystems allows us to conduct long-term research that addresses important basic theories and yet has significant relevance to regional, national and international priorities. The...
Types: Map Service,
OGC WFS Layer,
OGC WMS Layer,
OGC WMS Service;
Tags: Chihuahuan Desert,
English,
New Mexico,
US,
agency,
|

|
