Filters: Tags: Marin County (X)
137 results (375ms)|
Filters
Date Range
Extensions (Less) Types (Less)
Contacts (Less)
Categories (Less) Tag Types
|
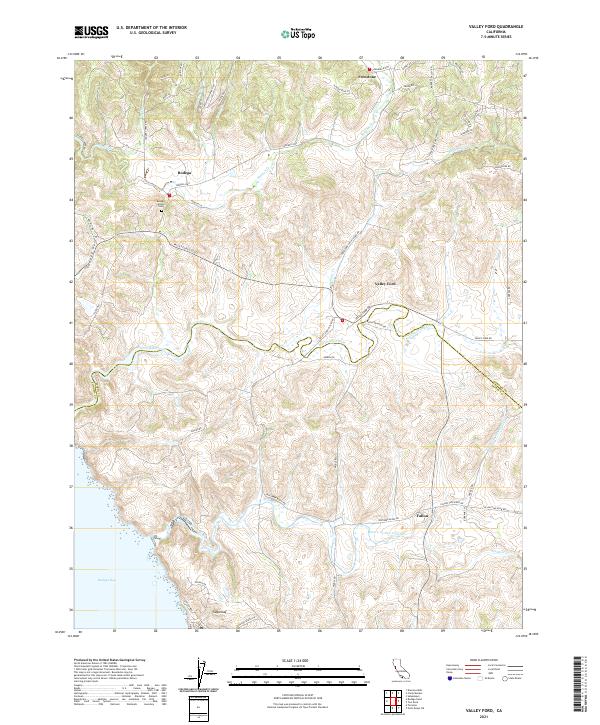
Layered geospatial PDF 7.5 Minute Quadrangle Map. Layers of geospatial data include orthoimagery, roads, grids, geographic names, elevation contours, hydrography, and other selected map features. This map is derived from GIS (geospatial information system) data. It represents a repackaging of GIS data in traditional map form, not creation of new information. The geospatial data in this map are from selected National Map data holdings and other government sources.
Layered geospatial PDF 7.5 Minute Quadrangle Map. Layers of geospatial data include orthoimagery, roads, grids, geographic names, elevation contours, hydrography, and other selected map features. This map is derived from GIS (geospatial information system) data. It represents a repackaging of GIS data in traditional map form, not creation of new information. The geospatial data in this map are from selected National Map data holdings and other government sources.
Layered geospatial PDF 7.5 Minute Quadrangle Map. Layers of geospatial data include orthoimagery, roads, grids, geographic names, elevation contours, hydrography, and other selected map features. This map is derived from GIS (geospatial information system) data. It represents a repackaging of GIS data in traditional map form, not creation of new information. The geospatial data in this map are from selected National Map data holdings and other government sources.
These data represent trapping effort and captures of deer mice at Point Reyes National Seashore, Marin County, California. Deer mice were captured and marked with ear tags to allow identification of individuals. The location of captures can be used in a spatially explicit capture recapture model to estimate density of mice and how mouse density varies by site and habitat type.
Categories: Data;
Types: Downloadable,
Map Service,
OGC WFS Layer,
OGC WMS Layer,
OGC WMS Service,
Shapefile;
Tags: California,
Ecology,
Marin County,
Point Reyes National Seashore,
USGS Science Data Catalog (SDC),

As part of the hydrodynamic and sediment transport investigations in San Pablo Bay and China Camp Marsh, California, particle size distributions of bed sediments were measured at most instrumented stations and are presented in a comma-delimited values spreadsheet. This portion of the data release presents San Pablo Bay and China Camp Marsh sediment particle size distributions from samples collected during multiple instrument deployments. Users are advised to check the data carefully for sampling time, location, and reference information.
Files contain hydrodynamic and sediment transport data for the location and deployment indicated. Time-series data of water depth, velocity, turbidity, and temperature were collected in San Pablo Bay and China Camp Marsh as part of the San Francisco Bay Marsh Sediment Experiments. Several instruments were deployed in tidal creek, marsh, mudflat, and Bay locations, gathering data on water depth, velocity, salinity/temperature, and turbidity. Deployment data are grouped by region (Bay channel (main Bay), Bay shallows, tidal creek, or marsh/mudflat/upper tidal creek). Users are advised to check metadata and instrument information carefully for applicable time periods of specific data, as individual instrument deployment...
Files contain hydrodynamic and sediment transport data for the location and deployment indicated. Time-series data of water depth, velocity, turbidity, and temperature were collected in San Pablo Bay and China Camp Marsh as part of the San Francisco Bay Marsh Sediment Experiments. Several instruments were deployed in tidal creek, marsh, mudflat, and Bay locations, gathering data on water depth, velocity, salinity/temperature, and turbidity. Deployment data are grouped by region (Bay channel (main Bay), Bay shallows, tidal creek, or marsh/mudflat/upper tidal creek). Users are advised to check metadata and instrument information carefully for applicable time periods of specific data, as individual instrument deployment...
The dataset includes multiple file types (CSV, ArcGIS shapefiles, and images), data relates to the elemental analysis of fish otoliths. Otoliths examined in this study were from randomly-sampled individual Tidewater Goby (Eucyclogobius newberryi) and Prickly Sculpin (Cottus asper) from the adult population of Rodeo Lagoon and Rodeo Creek, Marin County, California. The fish were collected in April and August 2016.
This data release is currently being revised and is temporarily unavailable. Please contact rhkent@usgs.gov with any immediate requests. The U.S. Geological Survey Groundwater Ambient Monitoring and Assessment-Priority Basin Project (USGS GAMA-PBP) collected samples to be analyzed for per-and polyfluoroalkyl substances (PFAS) from domestic and public supply wells from May 2019 to September 2020. The datasets presented here include identification of the 28 PFAS constituents monitored by the project, Identification and brief characterization of the 211 GAMA-PBP wells for which samples were analyzed for PFAS during the study period, and analytical results for those groundwater samples, along with results for quality...
Categories: Data;
Tags: California,
Colusa County,
Environmental Health,
Geochemistry,
Humboldt County,

These vector contour lines are derived from the 3D Elevation Program using automated and semi-automated processes. They were created to support 1:24,000-scale CONUS and Hawaii, 1:25,000-scale Alaska, and 1:20,000-scale Puerto Rico / US Virgin Island topographic map products, but are also published in this GIS vector format. Contour intervals are assigned by 7.5-minute quadrangle, so this vector dataset is not visually seamless across quadrangle boundaries. The vector lines have elevation attributes (in feet above mean sea level on NAVD88), but this dataset does not carry line symbols or annotation.
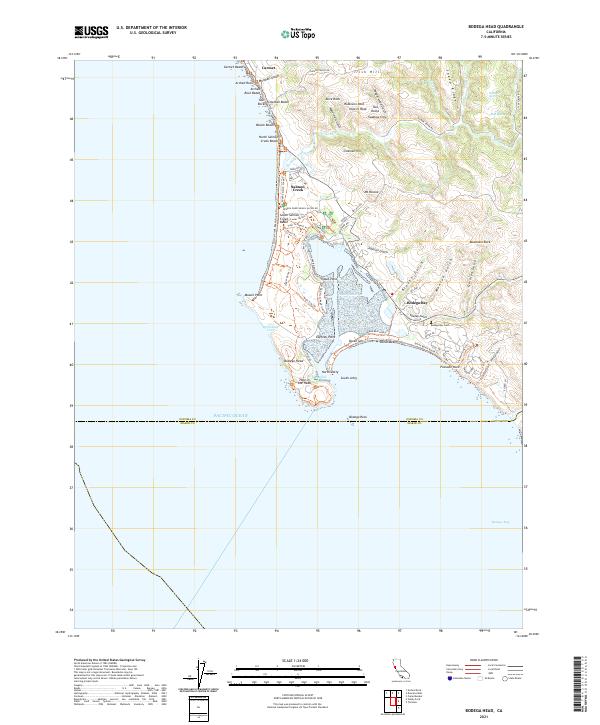
Layered geospatial PDF 7.5 Minute Quadrangle Map. Layers of geospatial data include orthoimagery, roads, grids, geographic names, elevation contours, hydrography, and other selected map features. This map is derived from GIS (geospatial information system) data. It represents a repackaging of GIS data in traditional map form, not creation of new information. The geospatial data in this map are from selected National Map data holdings and other government sources.
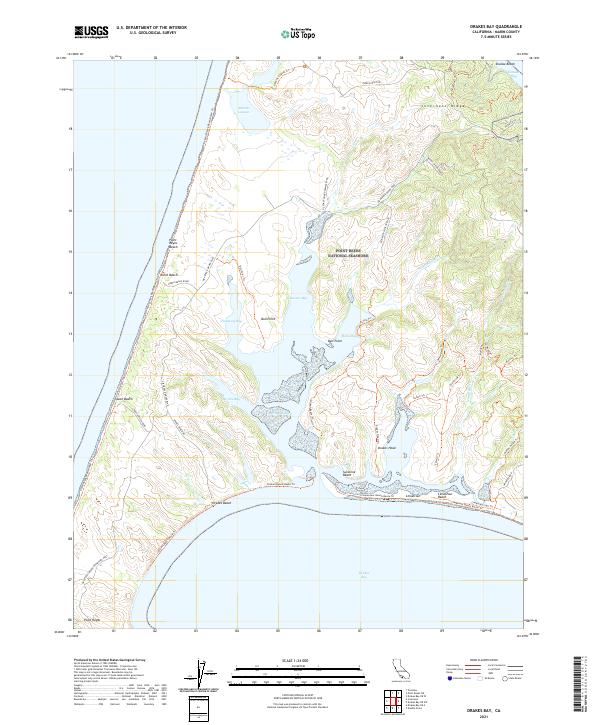
Layered geospatial PDF 7.5 Minute Quadrangle Map. Layers of geospatial data include orthoimagery, roads, grids, geographic names, elevation contours, hydrography, and other selected map features. This map is derived from GIS (geospatial information system) data. It represents a repackaging of GIS data in traditional map form, not creation of new information. The geospatial data in this map are from selected National Map data holdings and other government sources.
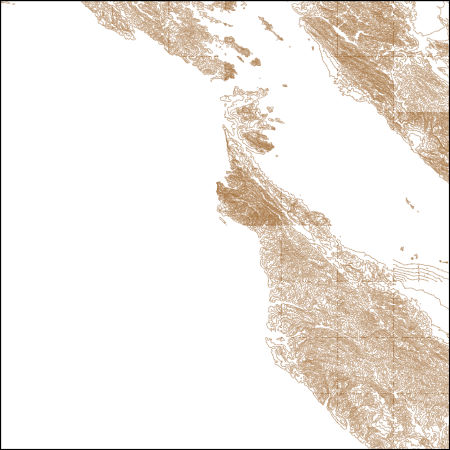
These vector contour lines are derived from the 3D Elevation Program using automated and semi-automated processes. They were created to support 1:24,000-scale CONUS and Hawaii, 1:25,000-scale Alaska, and 1:20,000-scale Puerto Rico / US Virgin Island topographic map products, but are also published in this GIS vector format. Contour intervals are assigned by 7.5-minute quadrangle, so this vector dataset is not visually seamless across quadrangle boundaries. The vector lines have elevation attributes (in feet above mean sea level on NAVD88), but this dataset does not carry line symbols or annotation.
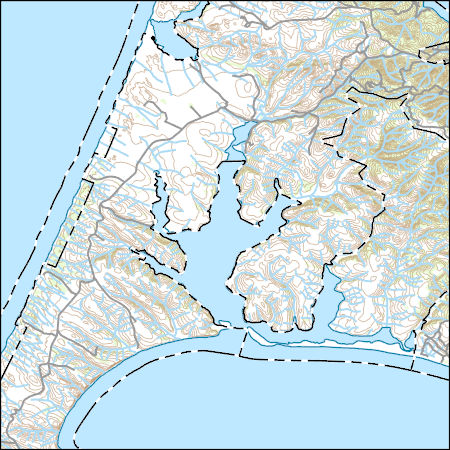
Layers of geospatial data include contours, boundaries, land cover, hydrography, roads, transportation, geographic names, structures, and other selected map features.
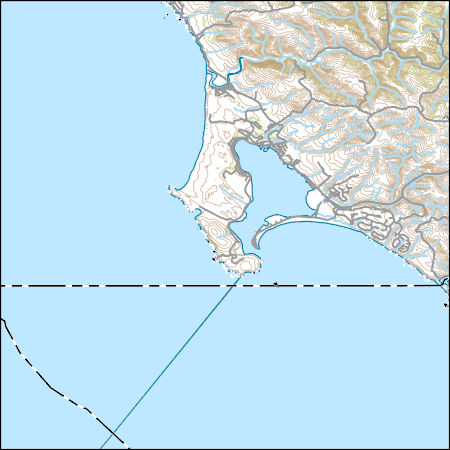
Layers of geospatial data include contours, boundaries, land cover, hydrography, roads, transportation, geographic names, structures, and other selected map features.
Field data for a spatial water quality map, using Yellow Spring Instruments (YSI) EXO2 sondes over a span of 160 minutes in Rodeo Lagoon, CA, on August 16th, 2016. This data release includes all measured environmental parameters included in the analysis.
Categories: Data;
Tags: Aquatic Biology,
California,
Ecology,
Environmental Health,
Golden Gate National Recreation Area,
Layers of geospatial data include contours, boundaries, land cover, hydrography, roads, transportation, geographic names, structures, and other selected map features.
Layers of geospatial data include contours, boundaries, land cover, hydrography, roads, transportation, geographic names, structures, and other selected map features.
Layers of geospatial data include contours, boundaries, land cover, hydrography, roads, transportation, geographic names, structures, and other selected map features.
Files contain hydrodynamic and sediment transport data for the location and deployment indicated. Time-series data of water depth, velocity, turbidity, and temperature were collected in San Pablo Bay and China Camp Marsh as part of the San Francisco Bay Marsh Sediment Experiments. Several instruments were deployed in tidal creek, marsh, mudflat, and Bay locations, gathering data on water depth, velocity, salinity/temperature, and turbidity. Deployment data are grouped by region (Bay channel (main Bay), Bay shallows, tidal creek, or marsh/mudflat/upper tidal creek). Users are advised to check metadata and instrument information carefully for applicable time periods of specific data, as individual instrument deployment...
|

|
