Filters: Tags: Maui (X)
177 results (19ms)|
Filters
Date Range
Extensions
Types Contacts
Categories Tag Types
|
This shapefile represents the spatial distribution of mean annual water-budget components, in inches, for the Island of Maui, Hawaii. The water-budget components in the shapefile were computed by a water-budget model for a scenario representative of current conditions (2001-10 rainfall and 2001-10 land cover), as described in USGS Scientific Investigations Report (USGS SIR) 2015-5164. The model was developed for estimating groundwater recharge and other water-budget components for each subarea of the model. The model-subarea dataset, consisting of 318,429 subareas (polygons), was generated using Esri ArcGIS software by intersecting (merging) multiple spatial datasets. Spatial datasets merged include those that characterize...
This data release contains a comma-delimited ascii file of six same-day, discrete discharge measurements made at sites along selected reaches of Kahoma Stream, Maui, Hawai'i on November 30, 2022. These discrete discharge measurements form what is commonly referred to as a “seepage run.” The intent of the seepage run is to quantify the spatial distribution of streamflow along the reach during fair-weather, low-flow conditions, generally characterized by negligible direct runoff within the reach. The measurements can be used to characterize the net seepage of water into (water gain) or out of (water loss) the stream channel between measurement sites provided that the measurements were made during stable, nonchanging...
USGS Historical Quadrangle in GeoPDF.

Steady-state numerical groundwater-flow models were constructed for the islands of Kaua'i, O'ahu, and Maui, Hawai'i. Separate models were created for each island using MODFLOW-2005 (Harbaugh, 2005) with the Seawater Intrusion (SWI2) package (Bakker and others, 2013), which allows simulation of freshwater and saltwater in ocean-island aquifers. The purpose of the models is to enable quantification of the hydrologic effects of withdrawals and changes in climate. These effects include water-table depression, saltwater rise, and reduction of natural groundwater discharge to streams, springs, and the ocean. The effects can place limits on groundwater availability. This USGS data release contains all of the input and...
The Geographic Names Information System (GNIS) is the Federal standard for geographic nomenclature. The U.S. Geological Survey developed the GNIS for the U.S. Board on Geographic Names, a Federal inter-agency body chartered by public law to maintain uniform feature name usage throughout the Government and to promulgate standard names to the public. The GNIS is the official repository of domestic geographic names data; the official vehicle for geographic names use by all departments of the Federal Government; and the source for applying geographic names to Federal electronic and printed products of all types.
Non-native grass removal as part of a larger restoration strategy has been demonstrated to assist in natural recruitment of important native plant species on the island of Maui. We monitored 90 Dodonaea viscosa seedlings across three sites within grass removal treatments to understand seedling survivorship, and whether non-native grass regrowth affected survivorship, in the Nakula Natural Area Reserve on Maui Island.
Categories: Data;
Tags: Maui,
Maui County,
Nakula Natural Area Reserve,
non-native grass,
seedling survival
This dataset contains information regarding where management should prioritize conservation efforts in the Hawaiian Island of Maui given current conditions and projected future conditions due to climate change. This dataset is an aggregation of many different datasets looking at the ecological and socio-cultural information inland and around the coast of the island.
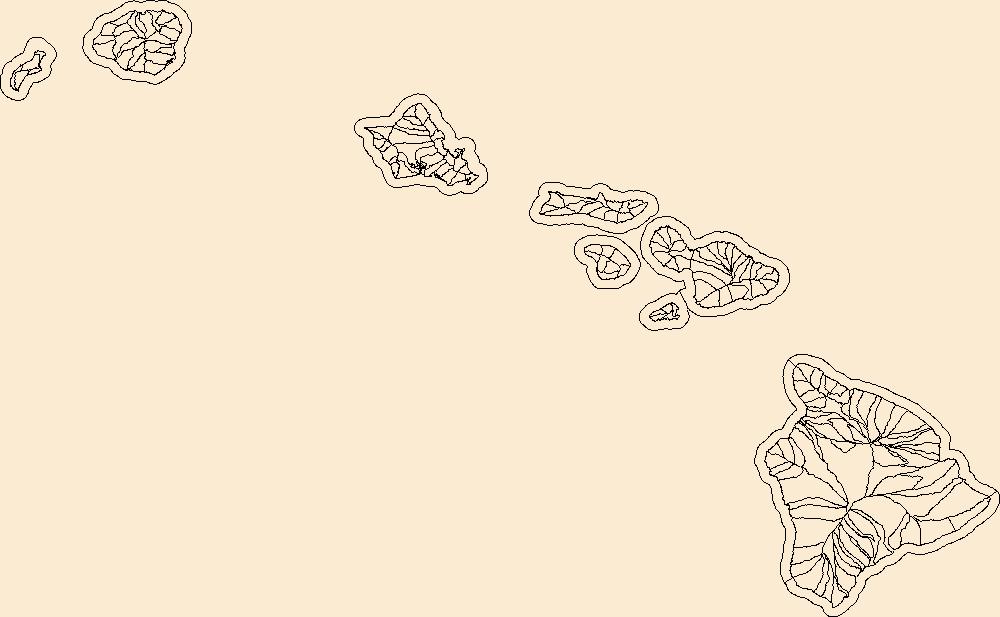
The National Hydrography Dataset (NHD) is a feature-based database that interconnects and uniquely identifies the stream segments or reaches that make up the nation's surface water drainage system. NHD data was originally developed at 1:100,000-scale and exists at that scale for the whole country. This high-resolution NHD, generally developed at 1:24,000/1:12,000 scale, adds detail to the original 1:100,000-scale NHD. (Data for Alaska, Puerto Rico and the Virgin Islands was developed at high-resolution, not 1:100,000 scale.) Local resolution NHD is being developed where partners and data exist. The NHD contains reach codes for networked features, flow direction, names, and centerline representations for areal water...
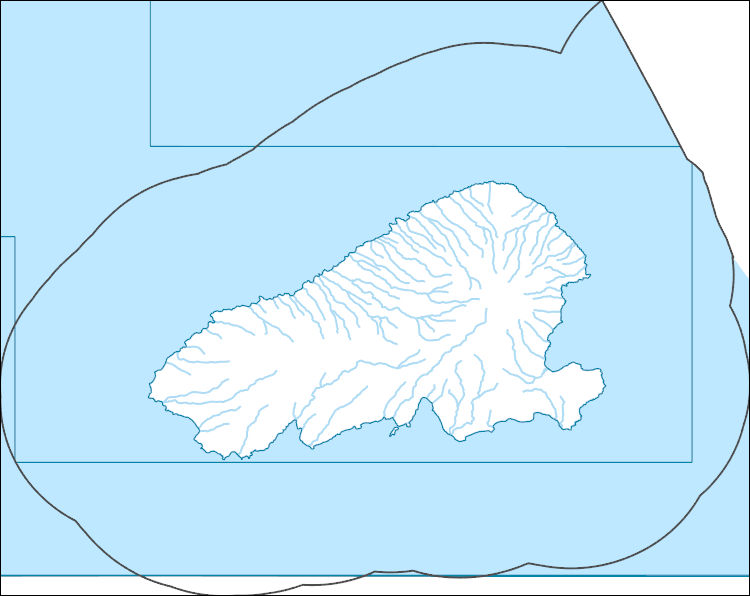
The Watershed Boundary Dataset (WBD) is a comprehensive aggregated collection of hydrologic unit data consistent with the national criteria for delineation and resolution. It defines the areal extent of surface water drainage to a point except in coastal or lake front areas where there could be multiple outlets as stated by the "Federal Standards and Procedures for the National Watershed Boundary Dataset (WBD)" "Standard" (https://pubs.usgs.gov/tm/11/a3/). Watershed boundaries are determined solely upon science-based hydrologic principles, not favoring any administrative boundaries or special projects, nor particular program or agency. This dataset represents the hydrologic unit boundaries to the 12-digit (6th level)...

The Watershed Boundary Dataset (WBD) is a comprehensive aggregated collection of hydrologic unit data consistent with the national criteria for delineation and resolution. It defines the areal extent of surface water drainage to a point except in coastal or lake front areas where there could be multiple outlets as stated by the "Federal Standards and Procedures for the National Watershed Boundary Dataset (WBD)" "Standard" (https://pubs.usgs.gov/tm/11/a3/). Watershed boundaries are determined solely upon science-based hydrologic principles, not favoring any administrative boundaries or special projects, nor particular program or agency. This dataset represents the hydrologic unit boundaries to the 12-digit (6th level)...
Layered GeoPDF 7.5 Minute Quadrangle Map. Layers of geospatial data include orthoimagery, roads, grids, geographic names, elevation contours, hydrography, and other selected map features.
Layered GeoPDF 7.5 Minute Quadrangle Map. Layers of geospatial data include orthoimagery, roads, grids, geographic names, elevation contours, hydrography, and other selected map features.
Layered GeoPDF 7.5 Minute Quadrangle Map. Layers of geospatial data include orthoimagery, roads, grids, geographic names, elevation contours, hydrography, and other selected map features.
Layered GeoPDF 7.5 Minute Quadrangle Map. Layers of geospatial data include orthoimagery, roads, grids, geographic names, elevation contours, hydrography, and other selected map features.
This shapefile represents the spatial distribution of mean annual water-budget components, in inches, for the Island of Maui, Hawaii. The water-budget components in the shapefile were computed by a water-budget model for a scenario representative of predevelopment conditions (1978–2007 rainfall and 1870 land cover), as described in USGS Scientific Investigations Report (SIR) 2015-5164. The model was developed for estimating groundwater recharge and other water-budget components for each subarea of the model. The model-subarea dataset, consisting of 318,429 subareas (polygons), was generated using Esri ArcGIS software by intersecting (merging) multiple spatial datasets. Spatial datasets merged include those that...
The University of Hawaiʻi at Mānoa and the U.S. Geological Survey, in cooperation with the County of Maui Department of Water Supply and the State of Hawaiʻi Commission on Water Resource Management, initiated a field data-collection program to provide information for evaluating how rates of water vapor and carbon dioxide exchange are dependent on plant species type within forested areas on the island of Maui. The field data collection is part of a study to quantify the impacts of high-priority non-native and dominant native plant species on freshwater availability throughout the State of Hawaiʻi (https://archive.usgs.gov/archive/sites/hi.water.usgs.gov/studies/maui_eco/index.html). The overall objective of the study...
This data release contains a comma-delimited ascii file of twenty same-day, discrete discharge measurements made at sites along selected reaches of Honokōhau Stream, Maui, Hawai'i on August 25, 2022. These discrete discharge measurements form what is commonly referred to as a “seepage run.” The intent of the seepage run is to quantify the spatial distribution of streamflow along the reach during fair-weather, low-flow conditions, generally characterized by negligible direct runoff within the reach. The measurements can be used to characterize the net seepage of water into (water gain) or out of (water loss) the stream channel between measurement sites provided that the measurements were made during stable, nonchanging...
The National Hydrography Dataset (NHD) is a feature-based database that interconnects and uniquely identifies the stream segments or reaches that make up the nation's surface water drainage system. NHD data was originally developed at 1:100,000-scale and exists at that scale for the whole country. This high-resolution NHD, generally developed at 1:24,000/1:12,000 scale, adds detail to the original 1:100,000-scale NHD. (Data for Alaska, Puerto Rico and the Virgin Islands was developed at high-resolution, not 1:100,000 scale.) Local resolution NHD is being developed where partners and data exist. The NHD contains reach codes for networked features, flow direction, names, and centerline representations for areal water...
Genetic diversity levels, population structure, and effective population size estimates of the endangered Hawaiian hoary bat (Lasiurus semotus, also known as Aeorestes semotus) were examined across the islands of Hawai‘i, Maui, O‘ahu, and Kaua‘i using eighteen nuclear microsatellite loci and one mitochondrial gene from 339 individuals collected between 1988 and 2020. The study extracted DNA for population genetic analyses from tissue samples, collected from live bats captured as part of ongoing field studies or under rehabilitation care, from bat carcasses collected by local federal and state wildlife agencies and wind energy facilities, and from dried skin specimens at the Bernice Pauahi Bishop Museum. A region...
This data release provides flooding extent polygons based on sea-level rise and wave-driven total water levels for the coast of the most populated Hawaiian Islands of Oahu, Molokai, Kauai, Maui, and Big Island. Oceanographic, coastal engineering, ecologic, and geospatial data and tools were combined to evaluate the increased risks of storm-induced coastal flooding due to climate change and sea-level rise. We followed risk-based valuation approaches to map flooding due to waves and storm surge at 10-m2 resolution along these islands' coastlines for annual (1-year), 20-year, and 100-year return-interval storm events and +0.25 m, +0.50 m, +1.00 m, +1.50 m, +2.00 m, and +3.00 m sea-level rise scenarios.
Categories: Data;
Tags: CMHRP,
Climate Change,
Coastal Processes,
Coastal and Marine Hazards and Resources Program,
Earth sciences,
|

|
