Filters: Tags: Missouri (X) > Date Range: {"choice":"year"} (X)
649 results (204ms)|
Filters
Date Types (for Date Range)
Types Contacts
Categories
Tag Types
|
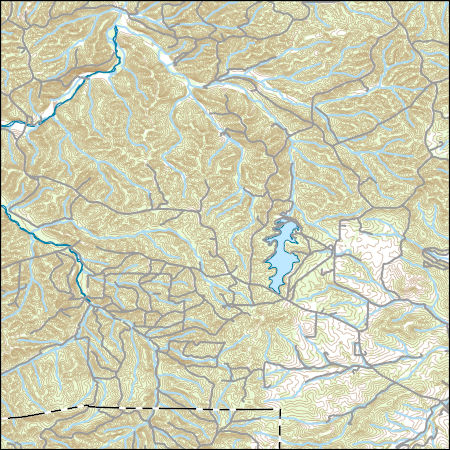
Layers of geospatial data include contours, boundaries, land cover, hydrography, roads, transportation, geographic names, structures, and other selected map features.
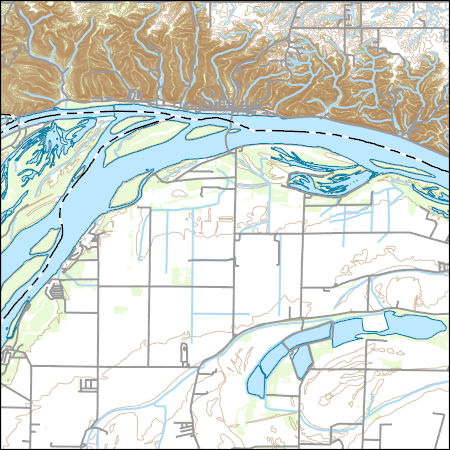
Layers of geospatial data include contours, boundaries, land cover, hydrography, roads, transportation, geographic names, structures, and other selected map features.
Forest Retention Index classes for the southeastern United States at 2040 were processed using the Forest Retention Decision Tree and rendered on a 30-meter by 30-meter grid. The Forest Retention Index is used only for current forestland, identified using National Land Cover Database 2011. Many datasets were used as inputs for the Forest Retention Decision Tree, and they can be grouped into five broad categories: Protected, Tier 1 Priority, Tier 2 Priority, Threats to Forest Retention, and Socio-Economic Value of Forests. Protected datasets include Protected Areas Database-United States, National Conservation Easement Database, state-maintained databases, and private datasets volunteered by conservation partners....
Categories: Data;
Types: ArcGIS REST Map Service,
ArcGIS Service Definition,
Downloadable,
Map Service;
Tags: Alabama,
Arkansas,
Florida,
Georgia,
Illinois,
Effective monitoring and prediction of flood and drought events requires an improved understanding of how and why surface-water expansion and contraction in response to climate varies across space. This paper sought to (1) quantify how interannual patterns of surface-water expansion and contraction vary spatially across the Prairie Pothole Region (PPR) and adjacent Northern Prairie (NP) in the United States, and (2) explore how landscape characteristics influence the relationship between climate inputs and surface-water dynamics. Due to differences in glacial history, the PPR and NP show distinct patterns in regards to drainage development and wetland density, together providing a diversity of conditions to examine...
This dataset provides results for the following: (1) metals concentrations in soils surrounding breeding song bird nest sites; (2) metals concentrations in invertebrates (earthworm and grub composites) collected near nest sites; (3) metals concentrations and delta-aminolevulinic acid dehydratase (ALAD) activity in avian blood samples; and (4) metals concentrations, indicators of oxidative stress and DNA damage, and histopathology in liver and/or kidney tissues collected from breeding song birds.
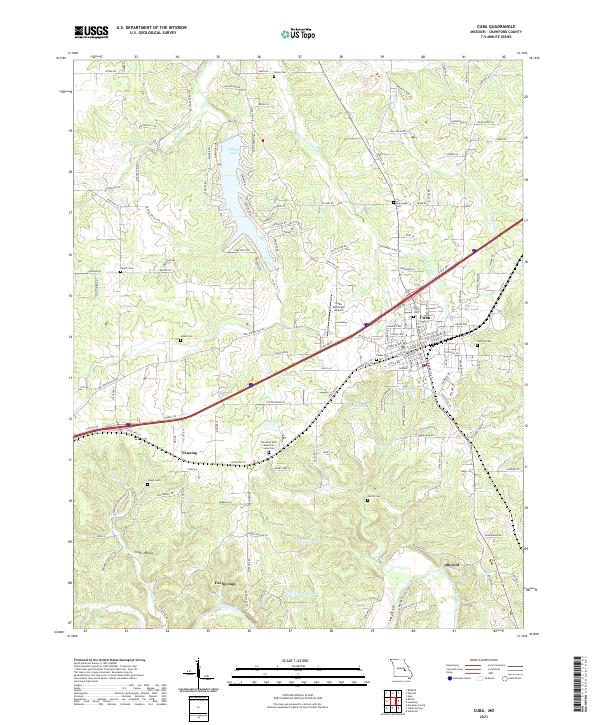
Layered geospatial PDF 7.5 Minute Quadrangle Map. Layers of geospatial data include orthoimagery, roads, grids, geographic names, elevation contours, hydrography, and other selected map features. This map is derived from GIS (geospatial information system) data. It represents a repackaging of GIS data in traditional map form, not creation of new information. The geospatial data in this map are from selected National Map data holdings and other government sources.
Layered geospatial PDF 7.5 Minute Quadrangle Map. Layers of geospatial data include orthoimagery, roads, grids, geographic names, elevation contours, hydrography, and other selected map features. This map is derived from GIS (geospatial information system) data. It represents a repackaging of GIS data in traditional map form, not creation of new information. The geospatial data in this map are from selected National Map data holdings and other government sources.
Layered geospatial PDF 7.5 Minute Quadrangle Map. Layers of geospatial data include orthoimagery, roads, grids, geographic names, elevation contours, hydrography, and other selected map features. This map is derived from GIS (geospatial information system) data. It represents a repackaging of GIS data in traditional map form, not creation of new information. The geospatial data in this map are from selected National Map data holdings and other government sources.
The Watershed Boundary Dataset (WBD) is a comprehensive aggregated collection of hydrologic unit data consistent with the national criteria for delineation and resolution. It defines the areal extent of surface water drainage to a point except in coastal or lake front areas where there could be multiple outlets as stated by the "Federal Standards and Procedures for the National Watershed Boundary Dataset (WBD)" "Standard" (https://pubs.usgs.gov/tm/11/a3/). Watershed boundaries are determined solely upon science-based hydrologic principles, not favoring any administrative boundaries or special projects, nor particular program or agency. This dataset represents the hydrologic unit boundaries to the 12-digit (6th level)...
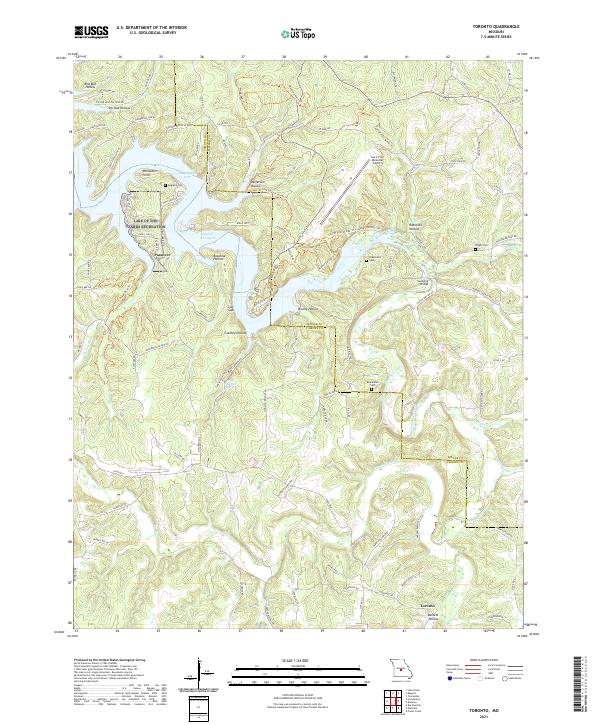
Layered geospatial PDF 7.5 Minute Quadrangle Map. Layers of geospatial data include orthoimagery, roads, grids, geographic names, elevation contours, hydrography, and other selected map features. This map is derived from GIS (geospatial information system) data. It represents a repackaging of GIS data in traditional map form, not creation of new information. The geospatial data in this map are from selected National Map data holdings and other government sources.
Layered geospatial PDF 7.5 Minute Quadrangle Map. Layers of geospatial data include orthoimagery, roads, grids, geographic names, elevation contours, hydrography, and other selected map features. This map is derived from GIS (geospatial information system) data. It represents a repackaging of GIS data in traditional map form, not creation of new information. The geospatial data in this map are from selected National Map data holdings and other government sources.
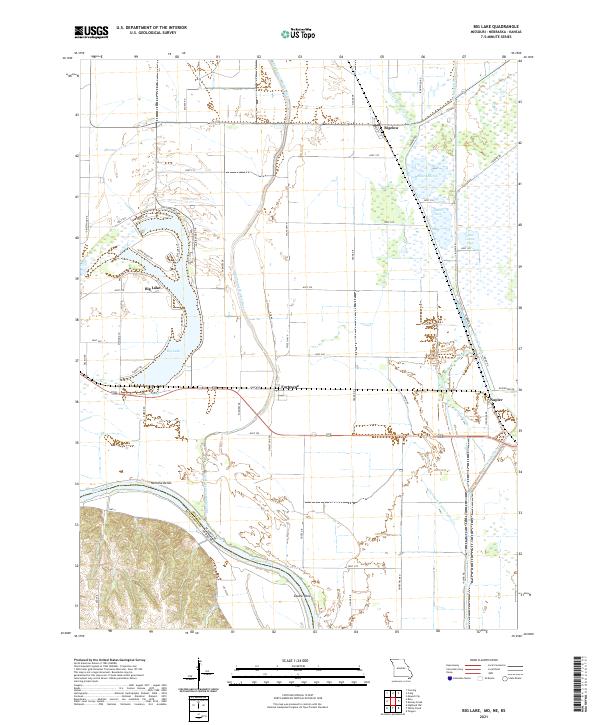
Layered geospatial PDF 7.5 Minute Quadrangle Map. Layers of geospatial data include orthoimagery, roads, grids, geographic names, elevation contours, hydrography, and other selected map features. This map is derived from GIS (geospatial information system) data. It represents a repackaging of GIS data in traditional map form, not creation of new information. The geospatial data in this map are from selected National Map data holdings and other government sources.

The Geographic Names Information System (GNIS) is the Federal standard for geographic nomenclature. The U.S. Geological Survey developed the GNIS for the U.S. Board on Geographic Names, a Federal inter-agency body chartered by public law to maintain uniform feature name usage throughout the Government and to promulgate standard names to the public. The GNIS is the official repository of domestic geographic names data; the official vehicle for geographic names use by all departments of the Federal Government; and the source for applying geographic names to Federal electronic and printed products of all types.

These data were released prior to the October 1, 2016 effective date for the USGS’s policy dictating the review, approval, and release of scientific data as referenced in USGS Survey Manual Chapter 502.8 Fundamental Science Practices: Review and Approval of Scientific Data for Release. This data set represents the average monthly maximum temperature in Celsius multiplied by 100 for 2002 compiled for every catchment of NHDPlus for the conterminous United States. The source data were the Near-Real-Time High-Resolution Monthly Average Maximum/Minimum Temperature for the Conterminous United States for 2002 raster dataset produced by the Spatial Climate Analysis Service at Oregon State University. The NHDPlus Version...

These data were released prior to the October 1, 2016 effective date for the USGS’s policy dictating the review, approval, and release of scientific data as referenced in USGS Survey Manual Chapter 502.8 Fundamental Science Practices: Review and Approval of Scientific Data for Release. This tabular data set represents the area of each level 3 nutrient ecoregion in square meters compiled for every MRB_E2RF1 catchment of the Major River Basins (MRBs, Crawford and others, 2006). The source data are from the 2002 version of the U.S. Environmental Protection Agency's (USEPA) Aggregations of Level III Ecoregions for National Nutrient Assessment & Management Strategy (USEPA, 2002). The MRB_E2RF1 catchments are based on...

These data were released prior to the October 1, 2016 effective date for the USGS’s policy dictating the review, approval, and release of scientific data as referenced in USGS Survey Manual Chapter 502.8 Fundamental Science Practices: Review and Approval of Scientific Data for Release. This tabular data set represents the estimated area of level 3 ecological landscape regions (ecoregions), as defined by Omernik (1987), compiled for every MRB_E2RF1 catchment of the Major River Basins (MRBs, Crawford and others, 2006). The source data set is Level III Ecoregions of the Continental United States (U.S. Environmental Protection Agency, 2003). The MRB_E2RF1 catchments are based on a modified version of the U.S. Environmental...
The Geographic Names Information System (GNIS) is the Federal standard for geographic nomenclature. The U.S. Geological Survey developed the GNIS for the U.S. Board on Geographic Names, a Federal inter-agency body chartered by public law to maintain uniform feature name usage throughout the Government and to promulgate standard names to the public. The GNIS is the official repository of domestic geographic names data; the official vehicle for geographic names use by all departments of the Federal Government; and the source for applying geographic names to Federal electronic and printed products of all types.
Wildlife species face threats from climate and land use change, which may exacerbate how extreme climatic events influence population persistence and biodiversity. Migratory waterbirds are especially vulnerable to hydrological drought via reduced availability of surface water habitats. We assessed how whooping cranes, an endangered species in the U.S. and Canada, modified habitat use and migration strategies during drought to understand this species’ resilience to changing conditions and adaptive capacity. The data included 8,555 night-roost sites used by 145 cranes, 2010–2022, under non-drought conditions, moderate drought, and extreme drought conditions.
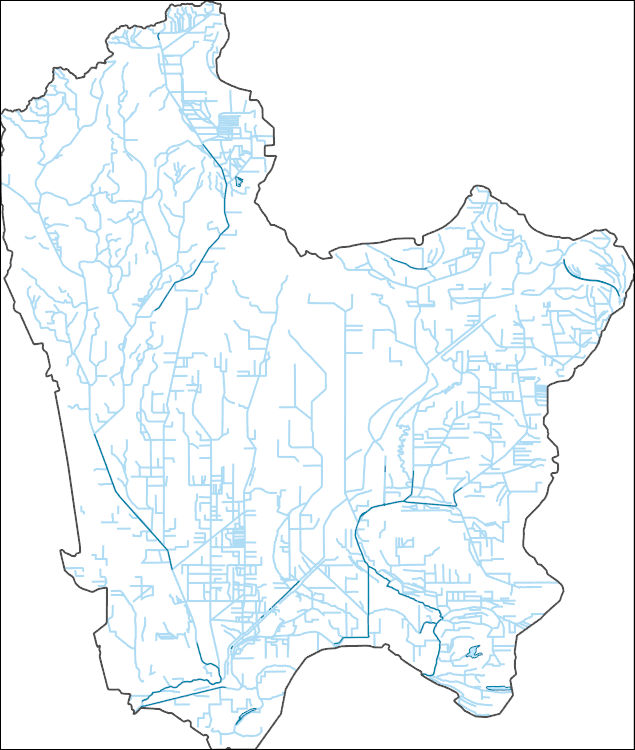
The National Hydrography Dataset (NHD) is a feature-based database that interconnects and uniquely identifies the stream segments or reaches that make up the nation's surface water drainage system. NHD data was originally developed at 1:100,000-scale and exists at that scale for the whole country. This high-resolution NHD, generally developed at 1:24,000/1:12,000 scale, adds detail to the original 1:100,000-scale NHD. (Data for Alaska, Puerto Rico and the Virgin Islands was developed at high-resolution, not 1:100,000 scale.) Local resolution NHD is being developed where partners and data exist. The NHD contains reach codes for networked features, flow direction, names, and centerline representations for areal water...
This child item describes Python code used to estimate average yearly and monthly tourism per 1000 residents within public-supply water service areas. Increases in population due to tourism may impact amounts of water used by public-supply water systems. This data release contains model input datasets, Python code used to develop the tourism information, and output estimates of tourism. This dataset is part of a larger data release using machine learning to predict public supply water use for 12-digit hydrologic units from 2000-2020. Output from this code was used as an input feature in the public supply delivery and water use machine learning models. This page includes the following files: tourism_input_data.zip...
|

|
