Filters: Tags: Model (X)
737 results (60ms)|
Filters
Date Range
Extensions Types Contacts
Categories Tag Types Tag Schemes |

MC1 is a dynamic vegetation model for estimating the distribution of vegetation and associated ecosystem fluxes of carbon, nutrients, and water. It was created to assess the potential impacts of global climate change on ecosystem structure and function at a wide range of spatial scales from landscape to global. The model incorporates transient dynamics to make predictions about the patterns of ecological change. MC1 was created by combining physiologically based biogeographic rules defined in the MAPSS model with a modified version of the biogeochemical model, CENTURY. MC1 includes a fire module, MCFIRE, that mechanistically simulates the occurrence and impacts of fire events. Climate input data sources for this...

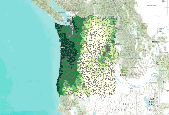
Soil residual water corresponds to the model variable "total streamflow." In the model MC1, this is calculated (in cm of water) as the water flowing through the soil profile below the last soil layer (streamflow), water leached into the subsoil (baseflow) and also includes runoff. The output is presented here as a monthly average. Soil residual water is part of the model output from Brendan Rogers' MS thesis work. Brendan used the vegetation model MC1 to simulate vegetation dynamics, associated carbon and nitrogen cycle, water budget and wild fire impacts across the western 2/3 of the states of Oregon and Washington using climate input data from the PRISM group (Chris Daly, OSU) at a 30arc second (800m) spatial...

Soil residual water corresponds to the model variable "total streamflow." In the model MC1, this is calculated (in cm of water) as the water flowing through the soil profile below the last soil layer (streamflow), water leached into the subsoil (baseflow) and also includes runoff. The output is presented here as a monthly average. Soil residual water is part of the model output from Brendan Rogers' MS thesis work. Brendan used the vegetation model MC1 to simulate vegetation dynamics, associated carbon and nitrogen cycle, water budget and wild fire impacts across the western 2/3 of the states of Oregon and Washington using climate input data from the PRISM group (Chris Daly, OSU) at a 30arc second (800m) spatial...

Soil residual water corresponds to the model variable "total streamflow." In the model MC1, this is calculated (in cm of water) as the water flowing through the soil profile below the last soil layer (streamflow), water leached into the subsoil (baseflow) and also includes runoff. The output is presented here as a monthly average. Soil residual water is part of the model output from Brendan Rogers' MS thesis work. Brendan used the vegetation model MC1 to simulate vegetation dynamics, associated carbon and nitrogen cycle, water budget and wild fire impacts across the western 2/3 of the states of Oregon and Washington using climate input data from the PRISM group (Chris Daly, OSU) at a 30arc second (800m) spatial...

Soil residual water corresponds to the model variable "total streamflow." In the model MC1, this is calculated (in cm of water) as the water flowing through the soil profile below the last soil layer (streamflow), water leached into the subsoil (baseflow) and also includes runoff. The output is presented here as a monthly average. Soil residual water is part of the model output from Brendan Rogers' MS thesis work. Brendan used the vegetation model MC1 to simulate vegetation dynamics, associated carbon and nitrogen cycle, water budget and wild fire impacts across the western 2/3 of the states of Oregon and Washington using climate input data from the PRISM group (Chris Daly, OSU) at a 30arc second (800m) spatial...

Soil residual water corresponds to the model variable "total streamflow." In the model Mc1, this is calculated (in cm of water) as the water flowing through the soil profile below the last soil layer (streamflow), Water leached in the subsoil (baseflow) and also includes runoff. the output is prsented here as a monthly average. Soil residual water is part of the model output from Brendan Rogers' MS thesis work. Brendan used the vegetation model MC1 to simulate vegetation dynamics, associated carbon and nitrogen cycle, water budget and wild fire impacts across the western 2/3 of the states of Oregon and Washington using climate input data from the PRISM group (Chris Daly, OSU) at a 30arc second (800m) spatial grain....
Energy autarky is presented as a conceptual framework for implementing sustainable regional development based on the transformation of the energy subsystem. It is conceptualized as a situation in which the energy services used for sustaining local consumption, local production and the export of goods and services are derived from locally renewable energy resources. Technically, the implementation of higher degrees of energy autarky rests on increasing energy efficiency, realizing the potential of renewable energy resources and relying on a decentralized energy system. Practically, a transition towards regional energy autarky requires administrations and civil society actors to initialize and develop projects at...
Categories: Publication;
Types: Citation;
Tags: Energy,
Energy consumption,
New Zealand,
Results,
consumption,
The primary supposition about renewable forms of energy is that use of such resources will not result in depletion or exhaustion. While it is true that natural energy flows such as sun and wind are not directly subject to degradation by use, there may still be indirect limitations on renewability. The exploitation of natural energy flows may require that systems of nonrenewable "support" resources be used to capture, store, and convert natural energy into useful forms. Poor resource management practices that degrade the support resources may therefore, in effect, endanger renewability. Biomass is an illustrative case of a renewable energy resource with nonrenewable support components. The soil and water management...
The primary supposition about renewable forms of energy is that use of such resources will not result in depletion or exhaustion. While it is true that natural energy flows such as sun and wind are not directly subject to degradation by use, there may still be indirect limitations on renewability. The exploitation of natural energy flows may require that systems of nonrenewable "support" resources be used to capture, store, and convert natural energy into useful forms. Poor resource management practices that degrade the support resources may therefore, in effect, endanger renewability. Biomass is an illustrative case of a renewable energy resource with nonrenewable support components. The soil and water management...
Joseph A. Dammel, Jeffrey M. Bielicki, Melisa F. Pollak, and Elizabeth J. Wilson at the University of Minnesota Center for Science, Technology, and Public Policy have published a feature article titled “A Tale of Two Technologies: Hydraulic Fracturing and Geologic Carbon Sequestration” that appears in the online version of the science journal, Environmental Science & Technology [subscription required]. In comparing, contrasting, and analyzing the regulatory landscape governing the use of hydraulic fracturing and geologic carbon sequestration, they conclude that “A shift toward a 21st Century vision of regulation is required. Hydraulic fracturing and geologic sequestration are both technologies that could reduce...

This dataset represents the average amount of soil carbon within each HUC5 watershed, simulated by the model MC1 for the 30-year period 1971-2000. Soil carbon, in g m-2, was determined for each HUC5 watershed. Watersheds represent 5th level (HUC5, 10-digit) hydrologic unit boundaries and were acquired from the Natural Resources Conservation Service. Background: The dynamic global vegetation model MC1 (see Bachelet et al.2001) was used to simulate vegetation dynamics, associated carbon and nitrogen cycle, water budget, and wild fire impacts for OR, WA, AZ and NM, for a project funded by the USDA Forest Service (PNW09-JV-11261900-003). The MC1 model was run using historical data and future climate change projections...
This dataset represents the average net primary production for each HUC5 watershed, simulated by the model MC1 for the 30-year period 1971-2000. Mean net primary production (in g m-2 per yr), was determined for each HUC5 watershed by averaging values of original ~ 4 km raster data. Watersheds represent 5th level (HUC5, 10-digit) hydrologic unit boundaries and were acquired from the Natural Resources Conservation Service. Background: The dynamic global vegetation model MC1 (see Bachelet et al.2001) was used to simulate vegetation dynamics, associated carbon and nitrogen cycle, water budget, and wild fire impacts for OR, WA, AZ and NM, for a project funded by the USDA Forest Service (PNW09-JV-11261900-003). The MC1...

Louisiana Waterthrush - VizBand/Land AIC Model Selection Created: 05-Oct-2011 Louisiana Waterthrush annual capture rate of adult (ADULT) individuals (log transformed) ranged between -0.220 and +2.009 with a mean value of +0.895 and a median value of +0.794. ________________________________________ Model 1 (2 parameters) Louisiana Waterthrush annual capture rate of adult (ADULT) individuals (log transformed) was a function of: a) DIST2RIV15 (-0.30142) - distance (m) to stream, ranged between -1.104 and +0.772 (95% CL) with a mean value of -0.166 and a median value of -0.121, b) NLCD06DE33P (+0.46681) - percent deciduous forest cover, 990m-resolution (33x aggregation of 30m-resolution), ranged between +1.446 and...

This map shows the predicted area of high fire potential for the current year up to the end of the forecast period as simulated by a modified version of the MC1 Dynamic General Vegetation Model (DGVM). Different colors indicate the level of consensus among five different MC1 simulations (i.e., one for each forecast provided by five different weather models), ranging from one of five to five of five simulations predicting high fire potential. The area of high fire potential is where PDSI and MC1-calculated values of potential fire behavior (fireline intensity for forest and shrubland and rate of spread of spread for grassland) exceed calibrated threshold values. Potential fire behavior in MC1 is estimated using...

This map shows the predicted area of high fire potential for the current year up to the end of the forecast period as simulated by a modified version of the MC1 Dynamic General Vegetation Model (DGVM). Different colors indicate the level of consensus among five different MC1 simulations (i.e., one for each forecast provided by five different weather models), ranging from one of five to five of five simulations predicting high fire potential. The area of high fire potential is where PDSI and MC1-calculated values of potential fire behavior (fireline intensity for forest and shrubland and rate of spread of spread for grassland) exceed calibrated threshold values. Potential fire behavior in MC1 is estimated using...

This map represents the change between 1971-2000 and 2070-2099 in the mean annual fraction of each gridcell affected by fire, as simulated by the model MC1 under the Hadley future climate projection and A2 anthropogenic emissions scenario. Data values are calculated as PART_BURN(2070-2099) minus PART_BURN(1971-2000). PART_BURN data is from MC1 version B60. The average annual fraction of cell burned for the respective 30-year periods increased in some of the 5,311 grid cells of the Apache-Sitgreaves study area and decreased in others. The range of data values is from -0.077 to +0.163. The mean value is +0.031. The vegetation model MC1 (e.g. Bachelet et al. 2001) was used to simulate vegetation dynamics, associated...

NARCCAP: http://www.narccap.ucar.edu/ The North American Regional Climate Change Assessment Program (NARCCAP) is an international program that will serve the climate scenario needs of the United States, Canada, and northern Mexico. NARCCAP is systematically investigating the uncertainties in future climate projections on the regional level. NARCCAP closely matches the regional climate models (RCMs) with multiple atmosphere-ocean general circulation models (AOGCMs) along with the A2 scenario from the Special Report on Emission Scenarios (SRES) over an area covering most of North America. NARCCAP also validates the regional climate model performance by driving the RCMs with reanalyses, which is similar to driving...

NARCCAP: http://www.narccap.ucar.edu/ The North American Regional Climate Change Assessment Program (NARCCAP) is an international program that will serve the climate scenario needs of the United States, Canada, and northern Mexico. NARCCAP is systematically investigating the uncertainties in future climate projections on the regional level. NARCCAP closely matches the regional climate models (RCMs) with multiple atmosphere-ocean general circulation models (AOGCMs) along with the A2 scenario from the Special Report on Emission Scenarios (SRES) over an area covering most of North America. NARCCAP also validates the regional climate model performance by driving the RCMs with reanalyses, which is similar to driving...

NARCCAP: http://www.narccap.ucar.edu/ The North American Regional Climate Change Assessment Program (NARCCAP) is an international program that will serve the climate scenario needs of the United States, Canada, and northern Mexico. NARCCAP is systematically investigating the uncertainties in future climate projections on the regional level. NARCCAP closely matches the regional climate models (RCMs) with multiple atmosphere-ocean general circulation models (AOGCMs) along with the A2 scenario from the Special Report on Emission Scenarios (SRES) over an area covering most of North America. NARCCAP also validates the regional climate model performance by driving the RCMs with reanalyses, which is similar to driving...
|

|

