Filters: Tags: Model (X)
737 results (56ms)|
Filters
Date Range
Extensions Types Contacts
Categories Tag Types Tag Schemes |

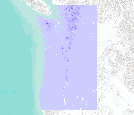
Standard Deviation of Annual Temperature (2045-2060) from HadCM3 GCM under A2 scenario (Western USA)
Ken Ferschweiler (CBI) used climate data from the PRISM group (Chris Daly, Oregon State University) at 4kmx4km spatial grain across the conterminous USA to generate a climatology or baseline. He then created future climate change scenarios using statistical downscaling and created anomalies from the Hadley CM3 General Circulation Model (GCM) run through the A2 emission scenario (SRES - special report on emission scenarios published in 2000). To run the MAPSS model (Neilson 1995), average monthly temperatures were calculated for the period 2045-2060. This dataset shows the standard deviation of the annual mean temperature for that period.

Percent perennial plant cover. The total perennial plant cover data were modeled using Moderate Resolution Imaging Spectroradiometer (MODIS) Enhanced Vegetation Index (EVI) collected by the MODIS satellite and composited over 16-day intervals (Wallace and others, 2008), combined with field measurements of total perennial cover, estimated from line intercept transects at locations across the Mojave Desert (Webb and others, 2003, 2009; Thomas and others, unpublished data; Wallace and others, 2008). Total perennial cover was related to elevation and 2001 through 2004 MODIS-EVI data at the transect locations (R2 = 0.82), and the resulting model was used to extrapolate cover estimates for the remaining study area. The...

Change in the majority generalized vegetation type for each HUC5 watershed between historical (1971-2000) and future (2071-2100) time periods. The MC1 dynamic vegetation model was run under the CSIRO, MIROC, and Hadley climate change projections and the A2 anthropogenic emissions scenario.Majority generalized vegetation type was determined for each HUC5 watershed from from original ~ 4 km raster data. Generalized vegetation types were assigned by combining detailed MC1 vegetation classes into four general catagories: desert, grassland, shrubland, and forest. Watersheds represent 5th level (HUC5, 10-digit) hydrologic unit boundaries and were acquired from the Natural Resources Conservation Service. Background:...

This dataset represents the average amount of Growing Degree Days (GDD) per year within each HUC5 watershed. Growing degree days (referenced to 0oC) (unit = deg C days) were determined for each HUC5 watershed. Watersheds represent 5th level (HUC5, 10-digit) hydrologic unit boundaries. They were acquired from the Natural Resources Conservation Service. Background: The dynamic global vegetation model MC1 (see Bachelet et al. 2001) was used to simulate vegetation dynamics, associated carbon and nitrogen cycle, water budget, and wild fire impacts for OR, WA, AZ and NM, for a project funded by the USDA Forest Service (PNW 09-JV-11261900-003). The MC1 model was run using historical data and future climate change...

Percent change in the average surface runoff for each HUC5 watershed between historical (1971-2000) and future (2071-2100) time periods. The MC1 dynamic vegetation model was run under the CSIRO, MIROC, and Hadley climate change projections and the A2 anthropogenic emissions scenario.Simulated mean annual surface runoff (in mm H2O yr-1), was determined for each HUC5 watershed by averaging values of original ~ 4 km raster data. Watersheds represent 5th level (HUC5, 10-digit) hydrologic unit boundaries and were acquired from the Natural Resources Conservation Service. Background: The dynamic global vegetation model MC1 (see Bachelet et al. 2001) was used to simulate vegetation dynamics, associated carbon and nitrogen...

This dataset represents the average annual precipitation for each HUC5 watershed, simulated by the model MC1 for the 30-year period 1971-2000. Mean annual precipitation (in mm H2O yr-1), was determined for each HUC5 watershed by averaging values of original ~ 4 km raster data. Watersheds represent 5th level (HUC5, 10-digit) hydrologic unit boundaries and were acquired from the Natural Resources Conservation Service. Background: The dynamic global vegetation model MC1 (see Bachelet et al.2001) was used to simulate vegetation dynamics, associated carbon and nitrogen cycle, water budget, and wild fire impacts for OR, WA, AZ and NM, for a project funded by the USDA Forest Service (PNW09-JV-11261900-003). The MC1...

Percent change in the average C3 grass fraction (a biogeographic index based on the ratio of C3 to C4 grass) for each HUC5 watershed between historical (1971-2000) and future (2071-2100) time periods. The MC1 dynamic vegetation model was run under the CSIRO, MIROC, and Hadley climate change projections and the A2 anthropogenic emissions scenario.Simulated mean C3 grass fraction was determined for each HUC5 watershed. Watersheds represent 5th level (HUC5, 10-digit) hydrologic unit boundaries and were acquired from the Natural Resources Conservation Service. Background: The dynamic global vegetation model MC1 (see Bachelet et al. 2001) was used to simulate vegetation dynamics, associated carbon and nitrogen cycle,...

This dataset represents the average amount of live tree carbon for each HUC5 watershed, simulated by the model MC1 for the 30-year period 1971-2000. Simulated mean live forest carbon (output variable C_Forestyr in MC1 version B60, which includes both above and below-ground tree carbon) was determined for each HUC5 watershed. Units are grams per square meter. Watersheds represent 5th level (HUC5, 10-digit) hydrologic unit boundaries and were acquired from the Natural Resources Conservation Service. Background: The dynamic global vegetation model MC1 (see Bachelet et al. 2001) was used to simulate vegetation dynamics, associated carbon and nitrogen cycle, water budget, and wild fire impacts for OR, WA, AZ and...

This product is one of a set of mapped model simulation results generated for a project called "Global Climate Change and California: Potential Implications for Ecosystems, Health, and the Economy". The project was conducted by the Electrical Power Research Institute (EPRI) and funded by the California Energy Commission's Public Interest Energy Research (PIER) Program. The project was the most detailed study ever undertaken on the potential effect of climate change on California. The work examined a broad array of potentially affected sectors as well as the interactions between climate change and increased population, economic growth, and technological change. It considered a wide range of climate change scenarios,...

This map shows the predicted area of high fire potential for the current year up to the end of the forecast period as simulated by a modified version of the MC1 Dynamic General Vegetation Model (DGVM). Different colors indicate the level of consensus among five different MC1 simulations (i.e., one for each forecast provided by five different weather models), ranging from one of five to five of five simulations predicting high fire potential. The area of high fire potential is where PDSI and MC1-calculated values of potential fire behavior (fireline intensity for forest and shrubland and rate of spread of spread for grassland) exceed calibrated threshold values. Potential fire behavior in MC1 is estimated using...

This map shows the predicted area of high fire potential for the current year up to the end of the forecast period as simulated by a modified version of the MC1 Dynamic General Vegetation Model (DGVM). Different colors indicate the level of consensus among five different MC1 simulations (i.e., one for each forecast provided by five different weather models), ranging from one of five to five of five simulations predicting high fire potential. The area of high fire potential is where PDSI and MC1-calculated values of potential fire behavior (fireline intensity for forest and shrubland and rate of spread of spread for grassland) exceed calibrated threshold values. Potential fire behavior in MC1 is estimated using...

Soil residual water corresponds to the model variable "total streamflow." In the model MC1, this is calculated (in cm of water) as the water flowing through the soil profile below the last soil layer (streamflow), water leached into the subsoil (baseflow) and also includes runoff. The output is presented here as a monthly average. Soil residual water is part of the model output from Brendan Rogers' MS thesis work. Brendan used the vegetation model MC1 to simulate vegetation dynamics, associated carbon and nitrogen cycle, water budget and wildfire impacts across the western 2/3 of the states of Oregon and Washington using climate input data from the PRISM group (Chris Daly, OSU) at a 30arc second (800m) spatial grain....
Soil residual water corresponds to the model variable "total streamflow"." In the model MC1, this is calculated (in cm of water) as the water flowing through the soil profile below the last soil layer (streamflow), water leached into the subsoil (baseflow) and also includes runoff. The output is presented here as a monthly average. Soil residual water is part of the model output from Brendan Rogers' MS thesis work. Brendan used the vegetation model MC1 to simulate vegetation dynamics, associated carbon and nitrogen cycle, water budget and wild fire impacts across the western 2/3 of the states of Oregon and Washington using climate input data from the PRISM group (Chris Daly, OSU) at a 30arc second (800m) spatial...

This collection of layers includes summary statistics from input and output data used for simulation of vegetation response to climate change in California. The historical data layers represent the 30 year period from 1961 to 1990. Future data layers represent each four 20 year periods: 2010-2029, 2030-2049, 2060-2079, and 2080-2099. The simulations were performed using MC1 dynamic global vegetation model (DGVM), source code revision 152. The model was parameterized and evaluated by the DGVM research group at the US Forest Service Pacific Northwest Research Station, with support from the Western Wildland Environmental Threat Assessment Center. The model was parameterized to maximize concordance with maps of potential...

This collection of layers includes summary statistics from input and output data used for simulation of vegetation response to climate change in California. The historical data layers represent the 30 year period from 1961 to 1990. Future data layers represent each four 20 year periods: 2010-2029, 2030-2049, 2060-2079, and 2080-2099. The simulations were performed using MC1 dynamic global vegetation model (DGVM), source code revision 152. The model was parameterized and evaluated by the DGVM research group at the US Forest Service Pacific Northwest Research Station, with support from the Western Wildland Environmental Threat Assessment Center. The model was parameterized to maximize concordance with maps of potential...

This map shows the predicted area of high fire potential for the current year up to the end of the forecast period as simulated by a modified version of the MC1 Dynamic General Vegetation Model (DGVM). Different colors indicate the level of consensus among five different MC1 simulations (i.e., one for each forecast provided by five different weather models), ranging from one of five to five of five simulations predicting high fire potential. The area of high fire potential is where PDSI and MC1-calculated values of potential fire behavior (fireline intensity for forest and shrubland and rate of spread of spread for grassland) exceed calibrated threshold values. Potential fire behavior in MC1 is estimated using...

The North American Regional Climate Change Assessment Program (NARCCAP) is an international program that will serve the climate scenario needs of the United States, Canada, and northern Mexico. NARCCAP is systematically investigating the uncertainties in future climate projections on the regional level. NARCCAP closely matches the regional climate models (RCMs) with multiple atmosphere-ocean general circulation models (AOGCMs) along with the A2 scenario from the Special Report on Emission Scenarios (SRES) over an area covering most of North America. NARCCAP also validates the regional climate model performance by driving the RCMs with reanalyses, which is similar to driving the models with observations. The basic...

The North American Regional Climate Change Assessment Program (NARCCAP) is an international program that will serve the climate scenario needs of the United States, Canada, and northern Mexico. NARCCAP is systematically investigating the uncertainties in future climate projections on the regional level. NARCCAP closely matches the regional climate models (RCMs) with multiple atmosphere-ocean general circulation models (AOGCMs) along with the A2 scenario from the Special Report on Emission Scenarios (SRES) over an area covering most of North America. NARCCAP also validates the regional climate model performance by driving the RCMs with reanalyses, which is similar to driving the models with observations. The basic...

SYNMAP is a new joint I-km global land cover product with improved characteristics for land cover parameterization of the carbon cycle models that reduces land cover uncertainties in carbon budget calculations. The overall advantage of the SYNMAP legend is that all classes are properly defined in terms of plant functional type mixtures, which can be remotely sensed and include the definitions of leaf type and longevity for each class with a tree component. SYNMAP is currently used for parameterization in a European model intercomparison initiative of three global vegetation models: BIOME-BGC, LPJ, and ORCHIDEE. Corroboration of SYNMAP against GLCC, GLC2000 and MODIS land cover products reveals improved agreement...

Blue-winged Warbler - VizBand/Land AIC Model Selection Created: 03-Jun-2011 Blue-winged Warbler annual capture rate of adult (ADULT) individuals (log transformed) ranged between -0.418 and +2.515 with a mean value of +1.049 and a median value of +0.902. ________________________________________ Model 1 (1 parameters) Blue-winged Warbler annual capture rate of adult (ADULT) individuals (log transformed) was a function of: a) NLCD06DE5KP (+0.27513) - percent deciduous forest cover, 990m-resolution in a landscape context of 5km radius, ranged between +2.449 and +5.203 (95% CL) with a mean value of +3.826 and a median value of +4.190. This model included data from 44 stations, explained 4 percent of the variation, and...
|

|
