Filters: Tags: Monterey County (X)
486 results (227ms)|
Filters
Date Range
Extensions Types Contacts
Categories Tag Types
|
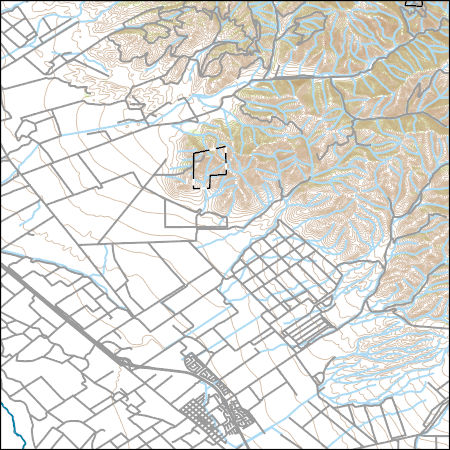
Layers of geospatial data include contours, boundaries, land cover, hydrography, roads, transportation, geographic names, structures, and other selected map features.
Layers of geospatial data include contours, boundaries, land cover, hydrography, roads, transportation, geographic names, structures, and other selected map features.
The U.S. Geological Survey (USGS) Geology, Geophysics and Geochemistry Science Center (GGGSC) collaborated with the USGS Science Analytics and Synthesis (SAS) team to preserve and release a subset of magnetotelluric data from the San Andreas Fault in Loma Prieta, California. The San Andreas Fault data were collected by the Branch of Geophysics, a precursor to the now GGGSC, between 1989 and 1994. The magnetotelluric data selected for this preservation project were collected in 1989 and 1990 using USGS portable truck mounted systems that measure the distribution of electrical conductivity beneath the surface of the earth. Truck mounted systems of this era output data to 3.5” discs, from which data were recovered...
These vector contour lines are derived from the 3D Elevation Program using automated and semi-automated processes. They were created to support 1:24,000-scale CONUS and Hawaii, 1:25,000-scale Alaska, and 1:20,000-scale Puerto Rico / US Virgin Island topographic map products, but are also published in this GIS vector format. Contour intervals are assigned by 7.5-minute quadrangle, so this vector dataset is not visually seamless across quadrangle boundaries. The vector lines have elevation attributes (in feet above mean sea level on NAVD88), but this dataset does not carry line symbols or annotation.
These vector contour lines are derived from the 3D Elevation Program using automated and semi-automated processes. They were created to support 1:24,000-scale CONUS and Hawaii, 1:25,000-scale Alaska, and 1:20,000-scale Puerto Rico / US Virgin Island topographic map products, but are also published in this GIS vector format. Contour intervals are assigned by 7.5-minute quadrangle, so this vector dataset is not visually seamless across quadrangle boundaries. The vector lines have elevation attributes (in feet above mean sea level on NAVD88), but this dataset does not carry line symbols or annotation.
Layers of geospatial data include contours, boundaries, land cover, hydrography, roads, transportation, geographic names, structures, and other selected map features.
This part of DS 781 presents data for the paleoshorelines for the geologic and geomorphic map of the Offshore of Monterey map area, California. The vector data file is included in "Paleoshorelines_OffshoreMonterey.zip," which is accessible from https://doi.org/10.5066/F70Z71C8. These data accompany the pamphlet and map sheets of Johnson, S.Y., Dartnell, P., Hartwell, S.R., Cochrane, G.R., Golden, N.E., Watt, J.T., Davenport, C.W., Kvitek, R.G., Erdey, M.D., Krigsman, L.M., Sliter, R.W., and Maier, K.L. (S.Y. Johnson and S.A. Cochran, eds.), 2016, California State Waters Map Series—Offshore of Monterey, California: U.S. Geological Survey Open-File Report 2016–1110, pamphlet 44 p., 10 sheets, scale 1:24,000, https://doi.org/10.3133/ofr20161110.
Categories: Data;
Types: Citation,
Downloadable,
Map Service,
OGC WFS Layer,
OGC WMS Layer,
Shapefile;
Tags: Bathymetry,
CMHRP,
Coastal and Marine Hazards and Resources Program,
Marina,
Monterey,
This part of DS 781 presents data for the bathymetry map of the Offshore of Monterey map area, California. Bathymetry data are provided as separate grids depending on resolution. This metadata file refers to the data included in "BathymetryHS_2m_OffshoreMonterey.zip," which is accessible from https://doi.org/10.5066/F70Z71C8. These data accompany the pamphlet and map sheets of Johnson, S.Y., Dartnell, P., Hartwell, S.R., Cochrane, G.R., Golden, N.E., Watt, J.T., Davenport, C.W., Kvitek, R.G., Erdey, M.D., Krigsman, L.M., Sliter, R.W., and Maier, K.L. (S.Y. Johnson and S.A. Cochran, eds.), 2016, California State Waters Map Series—Offshore of Monterey, California: U.S. Geological Survey Open-File Report 2016–1110,...
Categories: Data;
Types: Downloadable,
GeoTIFF,
Map Service,
Raster;
Tags: Backscatter,
Bathymetry,
Bathymetry,
CMHRP,
Coastal and Marine Hazards and Resources Program,
This part of DS 781 presents fold data for the geologic and geomorphic map of the Offshore of Monterey map area, California. The vector data file is included in "Folds_OffshoreMonterey.zip," which is accessible from https://doi.org/10.5066/F70Z71C8. These data accompany the pamphlet and map sheets of Johnson, S.Y., Dartnell, P., Hartwell, S.R., Cochrane, G.R., Golden, N.E., Watt, J.T., Davenport, C.W., Kvitek, R.G., Erdey, M.D., Krigsman, L.M., Sliter, R.W., and Maier, K.L. (S.Y. Johnson and S.A. Cochran, eds.), 2016, California State Waters Map Series—Offshore of Monterey, California: U.S. Geological Survey Open-File Report 2016–1110, pamphlet 44 p., 10 sheets, scale 1:24,000, https://doi.org/10.3133/ofr20161110....
Categories: Data;
Types: Citation,
Downloadable,
Map Service,
OGC WFS Layer,
OGC WMS Layer,
Shapefile;
Tags: Bathymetry,
CMHRP,
Coastal and Marine Hazards and Resources Program,
Continental/Island Shelf,
Marina,
This digital dataset contains the climate data used for the Lower Salinas Valley Hydrologic Models (Salinas Valley Integrated Hydrologic Model (SVIHM) and Salinas Valley Operational Model (SVOM)). The monthly climate data for the Lower Salinas Valley Hydrologic Models are based on the regional climate data for the Salinas Valley Hydrologic System [Hevesi and others, 2022]. To develop the monthly climate grids, the regional climate data were resampled to a monthly timescale and area weighted to the model grid. The climate data include spatially distributed monthly precipitation and potential evapotranspiration for the model grid for October 1967 to September 2018.
This part of DS 781 presents data for the sediment-thickness isopachs for the Pigeon Point to Monterey Bay, California, map region. The vector data file is included in "Isopachs_PigeonPointToMonterey.zip," which is accessible from https://doi.org/10.5066/F7N29V0Z. As part of the USGS's California State Waters Mapping Project, a 50-m-resolution grid of sediment thickness for the seafloor within the limit of California’s State Waters between Pigeon Point and southern Monterey Bay was generated from seismic-reflection data collected in 2009, 2010, and 2011 (USGS activities (S-15-10-NC, S-N1-09-MB, and S-06-11-MB) supplemented with outcrop and geologic structure from DS 781. Isopach contours at 2.5-meter intervals were...
Categories: Data;
Types: Downloadable,
Map Service,
OGC WFS Layer,
OGC WMS Layer,
Shapefile;
Tags: Ano Nuevo,
Aptos,
Distributions,
Marina,
Monterey,
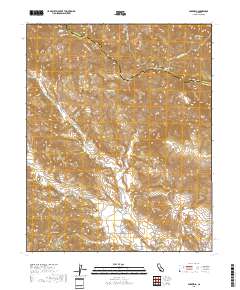
Layered geospatial PDF 7.5 Minute Quadrangle Map. Layers of geospatial data include orthoimagery, roads, grids, geographic names, elevation contours, hydrography, and other selected map features. This map is derived from GIS (geospatial information system) data. It represents a repackaging of GIS data in traditional map form, not creation of new information. The geospatial data in this map are from selected National Map data holdings and other government sources.
Layered geospatial PDF 7.5 Minute Quadrangle Map. Layers of geospatial data include orthoimagery, roads, grids, geographic names, elevation contours, hydrography, and other selected map features. This map is derived from GIS (geospatial information system) data. It represents a repackaging of GIS data in traditional map form, not creation of new information. The geospatial data in this map are from selected National Map data holdings and other government sources.
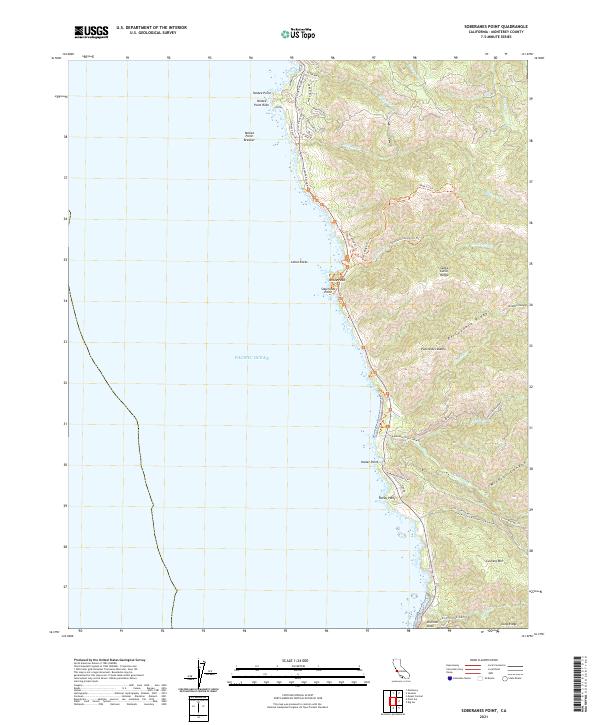
Layered geospatial PDF 7.5 Minute Quadrangle Map. Layers of geospatial data include orthoimagery, roads, grids, geographic names, elevation contours, hydrography, and other selected map features. This map is derived from GIS (geospatial information system) data. It represents a repackaging of GIS data in traditional map form, not creation of new information. The geospatial data in this map are from selected National Map data holdings and other government sources.
Layered geospatial PDF 7.5 Minute Quadrangle Map. Layers of geospatial data include orthoimagery, roads, grids, geographic names, elevation contours, hydrography, and other selected map features. This map is derived from GIS (geospatial information system) data. It represents a repackaging of GIS data in traditional map form, not creation of new information. The geospatial data in this map are from selected National Map data holdings and other government sources.
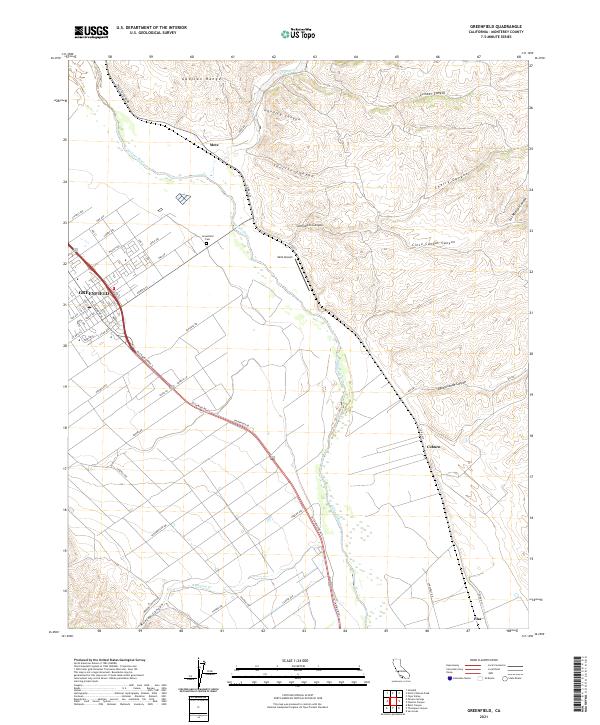
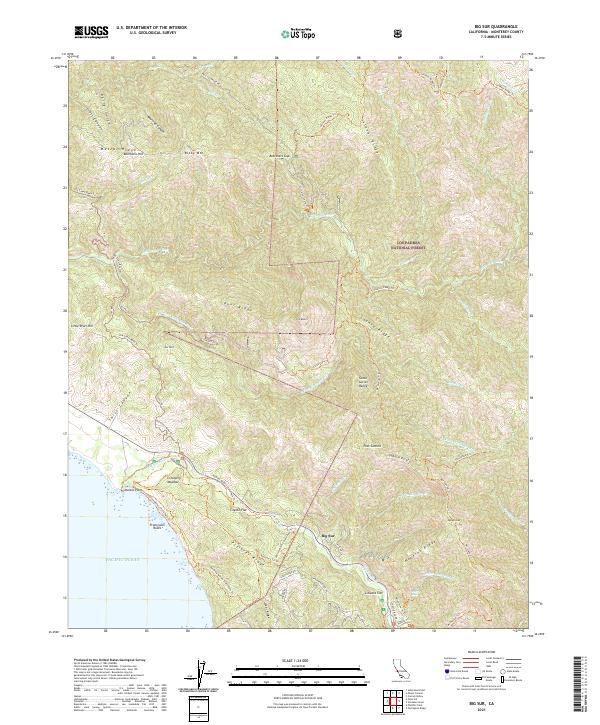
Layered geospatial PDF 7.5 Minute Quadrangle Map. Layers of geospatial data include orthoimagery, roads, grids, geographic names, elevation contours, hydrography, and other selected map features. This map is derived from GIS (geospatial information system) data. It represents a repackaging of GIS data in traditional map form, not creation of new information. The geospatial data in this map are from selected National Map data holdings and other government sources.
Layered geospatial PDF 7.5 Minute Quadrangle Map. Layers of geospatial data include orthoimagery, roads, grids, geographic names, elevation contours, hydrography, and other selected map features. This map is derived from GIS (geospatial information system) data. It represents a repackaging of GIS data in traditional map form, not creation of new information. The geospatial data in this map are from selected National Map data holdings and other government sources.
Layered geospatial PDF 7.5 Minute Quadrangle Map. Layers of geospatial data include orthoimagery, roads, grids, geographic names, elevation contours, hydrography, and other selected map features. This map is derived from GIS (geospatial information system) data. It represents a repackaging of GIS data in traditional map form, not creation of new information. The geospatial data in this map are from selected National Map data holdings and other government sources.
Layered geospatial PDF 7.5 Minute Quadrangle Map. Layers of geospatial data include orthoimagery, roads, grids, geographic names, elevation contours, hydrography, and other selected map features. This map is derived from GIS (geospatial information system) data. It represents a repackaging of GIS data in traditional map form, not creation of new information. The geospatial data in this map are from selected National Map data holdings and other government sources.
Layered geospatial PDF 7.5 Minute Quadrangle Map. Layers of geospatial data include orthoimagery, roads, grids, geographic names, elevation contours, hydrography, and other selected map features. This map is derived from GIS (geospatial information system) data. It represents a repackaging of GIS data in traditional map form, not creation of new information. The geospatial data in this map are from selected National Map data holdings and other government sources.
|

|
