Filters: Tags: Morongo Valley (X)
12 results (11ms)|
Filters
Date Range
Types Contacts
Tag Types Tag Schemes |
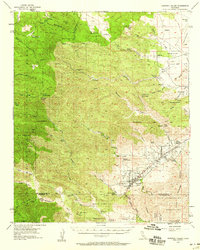
USGS Historical Quadrangle in GeoPDF.
Data for groundwater-levels measured in 616 wells during water year 2020 (November 2019-June 2020) by the United States Geological Survey (USGS), the Mojave Water Agency (MWA), and other local water districts were compiled to construct a regional water-table shapefile for 2020. The regional water-table shapefile shows the elevation of the water table in and around the Mojave River and Morongo areas, in San Bernardino County, California.
Types: Map Service,
OGC WFS Layer,
OGC WMS Layer,
OGC WMS Service;
Tags: Barstow,
California,
Coyote Lake,
Hydrology,
Joshua Tree North,
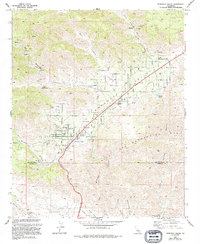
USGS Historical Quadrangle in GeoPDF.
This data set contains imagery from the National Agriculture Imagery Program (NAIP). The NAIP program is administered by USDA FSA and has been established to support two main FSA strategic goals centered on agricultural production. These are, increase stewardship of America's natural resources while enhancing the environment, and to ensure commodities are procured and distributed effectively and efficiently to increase food security. The NAIP program supports these goals by acquiring and providing ortho imagery that has been collected during the agricultural growing season in the U.S. The NAIP ortho imagery is tailored to meet FSA requirements and is a fundamental tool used to support FSA farm and conservation programs....
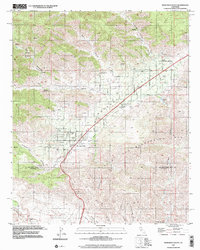
Data for groundwater-levels measured in 707 wells during January-July 2018 by the United States Geological Survey (USGS), the Mojave Water Agency (MWA), and other local water districts were compiled to construct a regional water-table shapefile for 2018. The regional water-table shapefile shows the elevation of the water table in and around the Mojave River and Morongo areas, in San Bernardino County, California.
Types: Map Service,
OGC WFS Layer,
OGC WMS Layer,
OGC WMS Service;
Tags: Barstow,
California,
Coyote Lake,
Hydrology,
Joshua Tree North,
This data set contains imagery from the National Agriculture Imagery Program (NAIP). The NAIP program is administered by USDA FSA and has been established to support two main FSA strategic goals centered on agricultural production. These are, increase stewardship of America's natural resources while enhancing the environment, and to ensure commodities are procured and distributed effectively and efficiently to increase food security. The NAIP program supports these goals by acquiring and providing ortho imagery that has been collected during the agricultural growing season in the U.S. The NAIP ortho imagery is tailored to meet FSA requirements and is a fundamental tool used to support FSA farm and conservation programs....
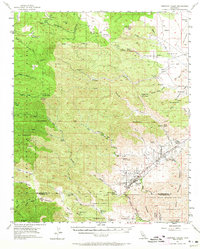
USGS Historical Quadrangle in GeoPDF.
USGS Historical Quadrangle in GeoPDF.
This data set contains imagery from the National Agriculture Imagery Program (NAIP). The NAIP program is administered by USDA FSA and has been established to support two main FSA strategic goals centered on agricultural production. These are, increase stewardship of America's natural resources while enhancing the environment, and to ensure commodities are procured and distributed effectively and efficiently to increase food security. The NAIP program supports these goals by acquiring and providing ortho imagery that has been collected during the agricultural growing season in the U.S. The NAIP ortho imagery is tailored to meet FSA requirements and is a fundamental tool used to support FSA farm and conservation programs....
USGS Historical Quadrangle in GeoPDF.
|

|
