Filters: Tags: Myrtle Beach (X)
21 results (84ms)|
Filters
Date Range
Extensions Types
Contacts
Categories Tag Types Tag Schemes |
This data set contains imagery from the National Agriculture Imagery Program (NAIP). The NAIP program is administered by USDA FSA and has been established to support two main FSA strategic goals centered on agricultural production. These are, increase stewardship of America's natural resources while enhancing the environment, and to ensure commodities are procured and distributed effectively and efficiently to increase food security. The NAIP program supports these goals by acquiring and providing ortho imagery that has been collected during the agricultural growing season in the U.S. The NAIP ortho imagery is tailored to meet FSA requirements and is a fundamental tool used to support FSA farm and conservation programs....
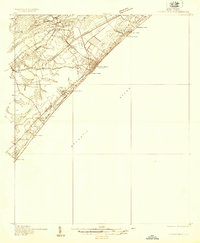
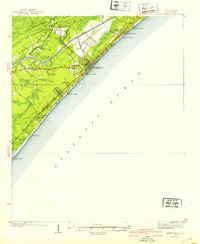
USGS Historical Quadrangle in GeoPDF.
USGS Historical Quadrangle in GeoPDF.
USGS Historical Quadrangle in GeoPDF.
As part of the Coastal Carolinas Focus Area Study of the U.S. Geological Survey National Water Census Program, the Soil and Water Assessment Tool (SWAT) was used to develop models for the Pee Dee River Basin, North Carolina and South Carolina, to simulate future streamflow and irrigation demand based on land use, climate, and water demand projections. SWAT is a basin-scale, process-based watershed model with the capability of simulating water-management scenarios. Model basins were divided into approximately two-square mile subbasins and subsequently divided into smaller, discrete hydrologic response units based on land use, slope, and soil type. The calibration period for the historic model was 2000 to 2014. The...
Types: Map Service,
OGC WFS Layer,
OGC WMS Layer,
OGC WMS Service;
Tags: Alexander,
Alleghany,
Anson,
Ashe,
Bladen,
Sandy ocean beaches in the United States are popular tourist and recreational destinations and constitute some of the most valuable real estate in the country. The boundary between land and water along the coastline is often the location of concentrated residential and commercial development and is frequently exposed to a range of natural hazards, which include flooding, storm effects, and coastal erosion. In response, the U.S. Geological Survey (USGS) is conducting a national assessment of coastal change hazards. One component of this research effort, the National Assessment of Shoreline Change Project (http://coastal.er.usgs.gov/shoreline-change/), documents changes in shoreline position as a proxy for coastal...
Categories: Data;
Types: Citation,
Downloadable,
Map Service,
OGC WFS Layer,
OGC WMS Layer,
Shapefile;
Tags: Atlantic Coast,
Bull Island,
CERC,
CERC map,
CMGP,
This data set contains imagery from the National Agriculture Imagery Program (NAIP). The NAIP program is administered by USDA FSA and has been established to support two main FSA strategic goals centered on agricultural production. These are, increase stewardship of America's natural resources while enhancing the environment, and to ensure commodities are procured and distributed effectively and efficiently to increase food security. The NAIP program supports these goals by acquiring and providing ortho imagery that has been collected during the agricultural growing season in the U.S. The NAIP ortho imagery is tailored to meet FSA requirements and is a fundamental tool used to support FSA farm and conservation programs....
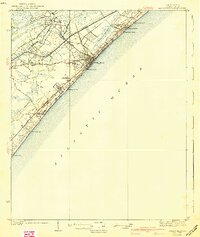
USGS Historical Quadrangle in GeoPDF.
Sandy ocean beaches in the United States are popular tourist and recreational destinations and constitute some of the most valuable real estate in the country. The boundary between land and water along the coastline is often the location of concentrated residential and commercial development and is frequently exposed to a range of natural hazards, which include flooding, storm effects, and coastal erosion. In response, the U.S. Geological Survey (USGS) is conducting a national assessment of coastal change hazards. One component of this research effort, the National Assessment of Shoreline Change Project (http://coastal.er.usgs.gov/shoreline-change/), documents changes in shoreline position as a proxy for coastal...
Categories: Data;
Types: Citation,
Downloadable,
Map Service,
OGC WFS Layer,
OGC WMS Layer,
Shapefile;
Tags: Accretion,
Atlantic Coast,
Bull Island,
CMGP,
Cape Romain,
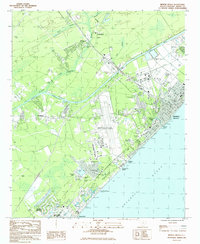
USGS Historical Quadrangle in GeoPDF.
This data set contains imagery from the National Agriculture Imagery Program (NAIP). The NAIP program is administered by USDA FSA and has been established to support two main FSA strategic goals centered on agricultural production. These are, increase stewardship of America's natural resources while enhancing the environment, and to ensure commodities are procured and distributed effectively and efficiently to increase food security. The NAIP program supports these goals by acquiring and providing ortho imagery that has been collected during the agricultural growing season in the U.S. The NAIP ortho imagery is tailored to meet FSA requirements and is a fundamental tool used to support FSA farm and conservation programs....
Sandy ocean beaches in the United States are popular tourist and recreational destinations and constitute some of the most valuable real estate in the country. The boundary between land and water along the coastline is often the location of concentrated residential and commercial development and is frequently exposed to a range of natural hazards, which include flooding, storm effects, and coastal erosion. In response, the U.S. Geological Survey (USGS) is conducting a national assessment of coastal change hazards. One component of this research effort, the National Assessment of Shoreline Change Project (http://coastal.er.usgs.gov/shoreline-change/), documents changes in shoreline position as a proxy for coastal...
Categories: Data;
Types: Citation,
Downloadable,
Map Service,
OGC WFS Layer,
OGC WMS Layer,
Shapefile;
Tags: Atlantic Coast,
Baseline,
Bull Island,
CMGP,
Cape Romain,
Sandy ocean beaches in the United States are popular tourist and recreational destinations and constitute some of the most valuable real estate in the country. The boundary between land and water along the coastline is often the location of concentrated residential and commercial development and is frequently exposed to a range of natural hazards, which include flooding, storm effects, and coastal erosion. In response, the U.S. Geological Survey (USGS) is conducting a national assessment of coastal change hazards. One component of this research effort, the National Assessment of Shoreline Change Project (http://coastal.er.usgs.gov/shoreline-change/), documents changes in shoreline position as a proxy for coastal...
Categories: Data;
Types: Citation,
Downloadable,
Map Service,
OGC WFS Layer,
OGC WMS Layer,
Shapefile;
Tags: Accretion,
Atlantic Coast,
Bull Island,
CMGP,
Cape Romain,
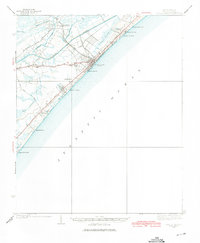
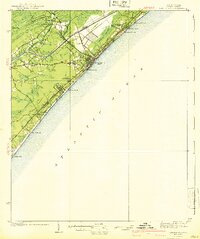
USGS Historical Quadrangle in GeoPDF.
Sandy ocean beaches in the United States are popular tourist and recreational destinations and constitute some of the most valuable real estate in the country. The boundary between land and water along the coastline is often the location of concentrated residential and commercial development and is frequently exposed to a range of natural hazards, which include flooding, storm effects, and coastal erosion. In response, the U.S. Geological Survey (USGS) is conducting a national assessment of coastal change hazards. One component of this research effort, the National Assessment of Shoreline Change Project (http://coastal.er.usgs.gov/shoreline-change/), documents changes in shoreline position as a proxy for coastal...
Categories: Data;
Types: Citation,
Downloadable,
Map Service,
OGC WFS Layer,
OGC WMS Layer,
Shapefile;
Tags: Accretion,
Atlantic Coast,
Bull Island,
CMGP,
Cape Romain,
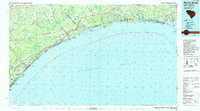
USGS Historical Quadrangle in GeoPDF.
USGS Historical Quadrangle in GeoPDF.
USGS Historical Quadrangle in GeoPDF.
Sandy ocean beaches in the United States are popular tourist and recreational destinations and constitute some of the most valuable real estate in the country. The boundary between land and water along the coastline is often the location of concentrated residential and commercial development and is frequently exposed to a range of natural hazards, which include flooding, storm effects, and coastal erosion. In response, the U.S. Geological Survey (USGS) is conducting a national assessment of coastal change hazards. One component of this research effort, the National Assessment of Shoreline Change Project (http://coastal.er.usgs.gov/shoreline-change/), documents changes in shoreline position as a proxy for coastal...
This data set contains imagery from the National Agriculture Imagery Program (NAIP). The NAIP program is administered by USDA FSA and has been established to support two main FSA strategic goals centered on agricultural production. These are, increase stewardship of America's natural resources while enhancing the environment, and to ensure commodities are procured and distributed effectively and efficiently to increase food security. The NAIP program supports these goals by acquiring and providing ortho imagery that has been collected during the agricultural growing season in the U.S. The NAIP ortho imagery is tailored to meet FSA requirements and is a fundamental tool used to support FSA farm and conservation programs....
|

|
