Filters: Tags: NAWQA (X)
397 results (58ms)|
Filters
Date Range
Extensions Types
Contacts
Categories Tag Types Tag Schemes |

These data were released prior to the October 1, 2016 effective date for the USGS’s policy dictating the review, approval, and release of scientific data as referenced in USGS Survey Manual Chapter 502.8 Fundamental Science Practices: Review and Approval of Scientific Data for Release. This is a vector GIS coverage (ESRI ArcInfo format) of the land use of the island of Oahu, 1998, derived from multiple sources of digital orthophotos.
Categories: pre-SM502.8;
Tags: Ford Island,
Geographic Information System,
Hawaii,
Mokauea Island,
Mokuoloe Island,

These data were released prior to the October 1, 2016 effective date for the USGS’s policy dictating the review, approval, and release of scientific data as referenced in USGS Survey Manual Chapter 502.8 Fundamental Science Practices: Review and Approval of Scientific Data for Release. A digital hydrologic network was developed to support SPAtially Referenced Regression on Watershed attributes (SPARROW) models within selected regions of the United States. These regions correspond with the U.S. Geological Survey's National Water Quality Assessment (NAWQA) Program Major River Basin (MRB) study units 2, 3, 4, 5, and 7 (Preston and others, 2009). MRB2, covers the South Atlantic-Gulf and Tennessee River basins. MRB3,...

These data were released prior to the October 1, 2016 effective date for the USGS’s policy dictating the review, approval, and release of scientific data as referenced in USGS Survey Manual Chapter 502.8 Fundamental Science Practices: Review and Approval of Scientific Data for Release. This 30-meter resolution raster data set of land cover for the conterminous United States ("NLCDep0905") was designed to describe conditions representative of the year 2000 and is the result of overlaying enhanced 1992 National Land Cover Data with 2000 population data at the block group geographic level. Any area (excluding water, developed land, or wetlands) with population density of at least 1,000 people per square mile was reclassified...
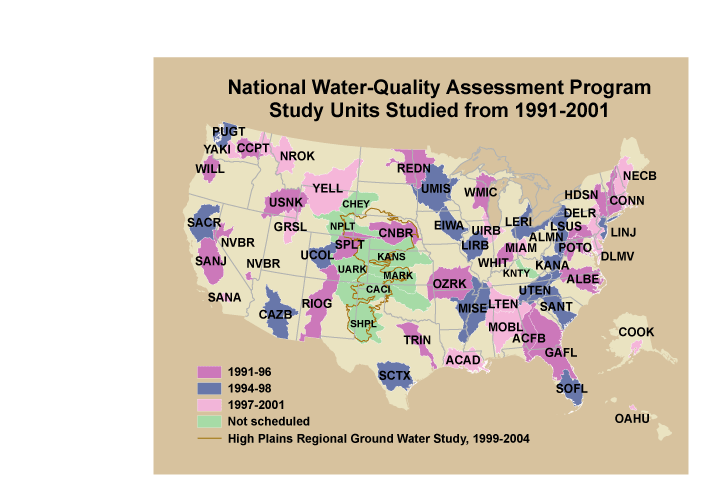
These data were released prior to the October 1, 2016 effective date for the USGS’s policy dictating the review, approval, and release of scientific data as referenced in USGS Survey Manual Chapter 502.8 Fundamental Science Practices: Review and Approval of Scientific Data for Release. This is a coverage of the boundaries and codes used for the U.S. Geological Survey's National Water-Quality Assessment (NAWQA) Program Study-Unit investigations in the conterminous United States, excluding the High Plains Regional Ground-Water Study. The data set represents the areas studied during the first decade of the NAWQA Program, from 1991-2001 ("cycle 1").
Categories: pre-SM502.8;
Tags: Aquifer system,
Conterminous United States,
Ground water,
NAWQA,
NSDI,
These data were released prior to the October 1, 2016 effective date for the USGS’s policy dictating the review, approval, and release of scientific data as referenced in USGS Survey Manual Chapter 502.8 Fundamental Science Practices: Review and Approval of Scientific Data for Release. This data set is a national map of predicted probability of nitrate contamination of shallow ground waters based on a logistic regression (LR) model. The LR model was used to predict the probability of nitrate contamination exceeding 4 mg/L in predominantly shallow, recently recharged ground waters of the United States. The model contains variables representing (1) nitrogen (N) fertilizer loading, (2) percent cropland-pasture, (3)...
These data were released prior to the October 1, 2016 effective date for the USGS’s policy dictating the review, approval, and release of scientific data as referenced in USGS Survey Manual Chapter 502.8 Fundamental Science Practices: Review and Approval of Scientific Data for Release. This dataset includes information for 200 pesticides on the average amount (pounds) applied to 87 agricultural crops and the acres of crops treated for counties within the conterminous United States. These data were derived by combining published state pesticide use coefficients published by the National Center for Food and Agricultural Policy (NCFAP) and county harvested crop acres available from the 1992 Census of Agriculture....
Categories: pre-SM502.8;
Tags: Census of Agriculture,
Conterminous United States,
NAWQA,
NSDI,
National Water Quality Assessment Program,

These data were released prior to the October 1, 2016 effective date for the USGS’s policy dictating the review, approval, and release of scientific data as referenced in USGS Survey Manual Chapter 502.8 Fundamental Science Practices: Review and Approval of Scientific Data for Release. This tabular dataset represents the estimated area of artificial drainage for the year 1992 and irrigation types for the year 1997 compiled for every catchment of NHDPlus for the conterminous United States. The source datasets were derived from tabular National Resource Inventory (NRI) datasets created by the National Resources Conservation Service (NRCS, U.S. Department of Agriculture, 1995, 1997). Artificial drainage is defined...

These data were released prior to the October 1, 2016 effective date for the USGS’s policy dictating the review, approval, and release of scientific data as referenced in USGS Survey Manual Chapter 502.8 Fundamental Science Practices: Review and Approval of Scientific Data for Release. This data set represents 1990 block group population density, in people per square kilometer, in the conterminous United States. This data set represents The data set was used as an input data layer for a national model to predict nitrate concentration in ground water used for drinking. Nolan and Hitt (2006) developed two national models to predict contamination of ground water by nonpoint sources of nitrate. The nonlinear approach...
Categories: pre-SM502.8;
Tags: Conterminous United States,
Drinking water,
Ground water,
Ground water contamination,
Ground water pollution,

These data were released prior to the October 1, 2016 effective date for the USGS’s policy dictating the review, approval, and release of scientific data as referenced in USGS Survey Manual Chapter 502.8 Fundamental Science Practices: Review and Approval of Scientific Data for Release. This data set represents the percent of cropland/pasture/fallow land cover in the conterminous United States. The data set was used as an input data layer for a national model to predict nitrate concentration in shallow ground water. Nolan and Hitt (2006) developed two national models to predict contamination of ground water by nonpoint sources of nitrate. The nonlinear approach to national-scale Ground-WAter Vulnerability Assessment...
Categories: pre-SM502.8;
Tags: Conterminous United States,
Cropland,
Fallow,
Ground water,
Ground water contamination,

These data were released prior to the October 1, 2016 effective date for the USGS’s policy dictating the review, approval, and release of scientific data as referenced in USGS Survey Manual Chapter 502.8 Fundamental Science Practices: Review and Approval of Scientific Data for Release. This data set represents the average annual nitrogen input from confined animal manure, 1992 and 1997, in kilograms per hectare, in the conterminous United States. The data set was used as an input data layer for a national model to predict nitrate concentration in shallow ground water. Nolan and Hitt (2006) developed two national models to predict contamination of ground water by nonpoint sources of nitrate. The nonlinear approach...

These data were released prior to the October 1, 2016 effective date for the USGS’s policy dictating the review, approval, and release of scientific data as referenced in USGS Survey Manual Chapter 502.8 Fundamental Science Practices: Review and Approval of Scientific Data for Release. This data set represents the area of National Resources Inventory surface drainage, field ditch conservation practice, in square kilometers, in the conterminous United States. The data set was used as an input data layer for a national model to predict nitrate concentration in ground water used for drinking. Nolan and Hitt (2006) developed two national models to predict contamination of ground water by nonpoint sources of nitrate....
Categories: pre-SM502.8;
Tags: Conterminous United States,
Drainage ditch,
Drinking water,
Ground water,
Ground water contamination,
This tabular data set represents population density, persons per square kilometer from 2000Census block level data, processed by James Falcone (USGS, 2016), compiled for two spatial components of the NHDPlus version 2 data suite (NHDPlusv2) for the conterminous United States; 1) individual reach catchments and 2) reach catchments accumulated upstream through the river network. This dataset can be linked to the NHDPlus version 2 data suite by the unique identifier COMID. The source data for population density was produced by the U.S. Geological Survey (Falcone, 2016). Units are persons per square kilometer. Reach catchment information characterizes data at the local scale. Reach catchments accumulated upstream through...
Types: Citation;
Tags: 2000 Population density,
Catchment,
Conterminous United States,
Inlandwaters,
NAWQA,
This tabular data set represents the percent of NLCD 2011 land cover classes in the 50 meter riparian buffer zones compiled for two spatial components of the NHDPlus version 2 data suite (NHDPlusv2) for the conterminous United States; 1) individual reach catchments and 2) reach catchments accumulated upstream through the river network. This dataset can be linked to the NHDPlus version 2 data suite by the unique identifier COMID. The source data is the "National Land Cover Database 2011" produced by the United States Geological Survey (Homer and others, 2011). Units are percent. Reach catchment information characterizes data at the local scale. Reach catchments accumulated upstream through the river network characterizes...
Types: Citation;
Tags: 50 meter riparian buffer,
Catchment,
Conterminous United States,
Inlandwaters,
NAWQA,
This tabular data set represents the percent of land cover classes from the 2012 Crop land Data Layer compiled for two spatial components of the NHDPlus version 2 data suite (NHDPlusv2) for the conterminous United States; 1) individual reach catchments and 2) reach catchments accumulated upstream through the river network. This dataset can be linked to the NHDPlus version 2 data suite by the unique identifier COMID. The source data is the "2012 Crop Land Data Layer" produced by the United States Department of Agriculture (USDA) National Agricultural Statistics Service (NASS, 2015). Reach catchment information characterizes data at the local scale. Reach catchments accumulated upstream through the river network characterizes...
This tabular data set represents the estimated distribution of Phosphorus (P) in the soil A and C horizons, milligrams per kilogram compiled for two spatial components of the NHDPlus version 2.1 data suite (hereto referred as NHDPlusv2) for the conterminous United States; 1) individual reach catchments and 2) reach catchments accumulated upstream through the river network. This dataset can be linked to the NHDPlus version 2 data suite by the unique identifier COMID. The source data is from the publication, Distribution of Phosphorus (P) in the soil A and C horizons, Terziotti, 2019). Units are milligrams per kilogram. Reach catchment information characterizes data at the local scale. Reach catchments accumulated...
This tabular data set represents the presence of six National Hydrography Dataset (NHD) high resolution waterbody types compiled for two spatial components of the NHDPlus version 2 data suite (NHDPlusv2) for the conterminous United States; 1) individual reach catchments and 2) reach catchments accumulated upstream through the river network. The six types of waterbodies presented here are: playa, ice mass, lake/pond, reservoir, swamp/marsh, and estuary. This dataset can be linked to the NHDPlus version 2 data suite by the unique identifier COMID. The source data is the NHDPlus high resolution waterbodies produced by USGS , 2015. Units are percent. Reach catchment information characterizes data at the local scale....
Types: Citation;
Tags: Catchment,
Conterminous United States,
Inlandwaters,
NAWQA,
NHD high resolution waterbodies,
This tabular data set represents 30 year average (1961-1990) of maximum monthly number of days of measurable precipitation per month compiled for two spatial components of the NHDPlus version 2 data suite (NHDPlusv2) for the conterminous United States; 1) individual reach catchments and 2) reach catchments accumulated upstream through the river network. This dataset can be linked to the NHDPlus version 2 data suite by the unique identifier COMID. The source data for 30 year average (1961-1990) of maximum monthly number of days of measurable precipitation was originally PRISM-based data, with some further enhancements by ClimateSource.com and then provided to the USGS by the Environmental Protection Agency (Ryan...
This tabular data set represents mean-annual actual evapotranspiration, estimated using the regression equation of Sanford and Selnick (2013) compiled for two spatial components of the NHDPlus version 2 data suite (NHDPlusv2) for the conterminous United States; 1) individual reach catchments and 2) reach catchments accumulated upstream through the river network. This dataset can be linked to the NHDPlus version 2 data suite by the unique identifier COMID. The source data for mean-annual actual evapotranspiration was produced by the USGS (Sanford and others, 2013) using the regression equation of Sanford and Selnick (2013). Units are millimeters per year. Reach catchment information characterizes data at the local...
This tabular data set represents NLCD 2006 percent imperviousness compiled for two spatial components of the NHDPlus version 2 data suite (NHDPlusv2) for the conterminous United States; 1) individual reach catchments and 2) reach catchments accumulated upstream through the river network. This dataset can be linked to the NHDPlus version 2 data suite by the unique identifier COMID. The source data is the "NLCD 2006 Percent Developed Imperviousness (2011 Edition, amended 2014) - National Geospatial Data Asset (NGDA) Land Use Land Cover" which was produced by the United States Geological Survey (Yang and others, 2011). Units are percent. Reach catchment information characterizes data at the local scale. Reach catchments...
This tabular data set represents annual average actual evapotranspiration values (millimeters) described in Wolock and McCabe (2017), compiled for the NHDPlus version 2 data suite (NHDPlusV2) for the conterminous United States for the years 2014 and 2015. Linkage of the actual evapotranspiration data with NHDPlusV2 is achieved through the common unique identifier COMID. The actual evapotranspiration values are estimated both for: 1) individual reach catchments and 2) reach catchments accumulated upstream through the river network. The reach catchment information characterizes data at the local scale, whereas the catchments accumulated through the river network characterize cumulative upstream conditions. The network-accumulated...
|

|
