Filters: Tags: NAWQA (X)
397 results (43ms)|
Filters
Date Range
Extensions Types
Contacts
Categories Tag Types Tag Schemes |
This tabular data set represents contact time, the length of time it takes for water to drain along subsurface flow paths to the stream, compiled for two spatial components of the NHDPlus version 2 data suite (NHDPlusv2) for the conterminous United States; 1) individual reach catchments and 2) reach catchments accumulated upstream through the river network. This dataset can be linked to the NHDPlus version 2 data suite by the unique identifier COMID. The source data for contact time was produced by Dave Wolock, (USGS, written communication, 2014) and based on the methods outlined in Wolock and others (1997). Units are days. Contact time is computed from basin topography, soil porosity, and soil hydraulic conductivity....
This tabular data set represents 30 year (1971 - 2000) mean annual temperature (Celsius) compiled for two spatial components of the NHDPlus version 2 data suite (NHDPlusv2) for the conterminous United States; 1) individual reach catchments and 2) reach catchments accumulated upstream through the river network. This dataset can be linked to the NHDPlus version 2 data suite by the unique identifier COMID. The source data for 30 year (1971 - 2000) mean annual temperature (Celsius) was produced by the PRISM Group at Oregon State University (PRISM, 2008). Units are degrees celsius. Reach catchment information characterizes data at the local scale. Reach catchments accumulated upstream through the river network characterizes...
Types: Citation;
Tags: 30 year mean annual temperature,
Catchment,
Conterminous United States,
Inlandwaters,
NAWQA,
This tabular data set represents the 30 year (1971 - 2000) mean annual minimum temperature (Celsius) from 800m PRISM data compiled for two spatial components of the NHDPlus version 2 data suite (NHDPlusv2) for the conterminous United States; 1) individual reach catchments and 2) reach catchments accumulated upstream through the river network. This dataset can be linked to the NHDPlus version 2 data suite by the unique identifier COMID. The source data for 30 year (1971 - 2000) mean annual minimum temperature (Celsius) from 800m PRISM data was produced by the PRISM Group at Oregon State University. Units are Degree Celsius. Reach catchment information characterizes data at the local scale. Reach catchments accumulated...
This tabular data set represents annual average temperature values (Celsius) described in Wolock and McCabe (2017), compiled for the NHDPlus version 2 data suite (NHDPlusV2) for the conterminous United States. Linkage of the temperature data with NHDPlusV2 is achieved through the common unique identifier COMID. The temperature values are estimated both for: 1) individual reach catchments and 2) reach catchments accumulated upstream through the river network. The reach catchment information characterizes data at the local scale, whereas the catchments accumulated through the river network characterize cumulative upstream conditions. The network-accumulated values are derived using two methods: 1) divergence routing...
This data release provides state-level estimates of annual agricultural use of pesticide compounds by major crop or crop group for states in the conterminous United States, for the time period 1992-2017, compiled from data used to make county-level estimates by means of methods described in Thelin and Stone (2013) and Baker and Stone (2015). The source of these data is the same as the published county-level pesticide use estimates for 1992-2009 (Stone, 2013), estimates for 2008-2012 (Baker and Stone, 2015), and estimates for 2013-17 (Wieben, 2019). County-level by-crop estimates are not published because of the increased uncertainty in estimating the geographic distribution of compounds applied to specific crops....
NOTE: Revisions to the dataset were necessary because the data for select compounds were missing from the original (version 1) pesticide use estimates. Pesticide use estimates for compounds with missing data have been updated in version 2.0. This data release has been superseded by version 2.0, available here: https://doi.org/10.5066/P9HHG3CT This data release provides state-level estimates of annual agricultural use of pesticide compounds by major crop or crop group for states in the conterminous United States, for the time period 1992-2017, compiled from data used to make county-level estimates by means of methods described in Thelin and Stone (2013) and Baker and Stone (2015). The source of these data is the...
This data release provides estimates of annual agricultural use of pesticide compounds in counties of the conterminous United States, for years 2013-17, compiled by means of methods described in Thelin and Stone (2013) and Baker and Stone (2015). For all States except California, U.S. Department of Agriculture county-level data for harvested-crop acreage were used in conjunction with proprietary Crop Reporting District-level pesticide-use data to estimate county-level pesticide use. Where Crop Reporting District data were not available or were incomplete, estimated pesticide-use values were calculated with two different methods, resulting in a low and a high estimate based on different assumptions about missing...
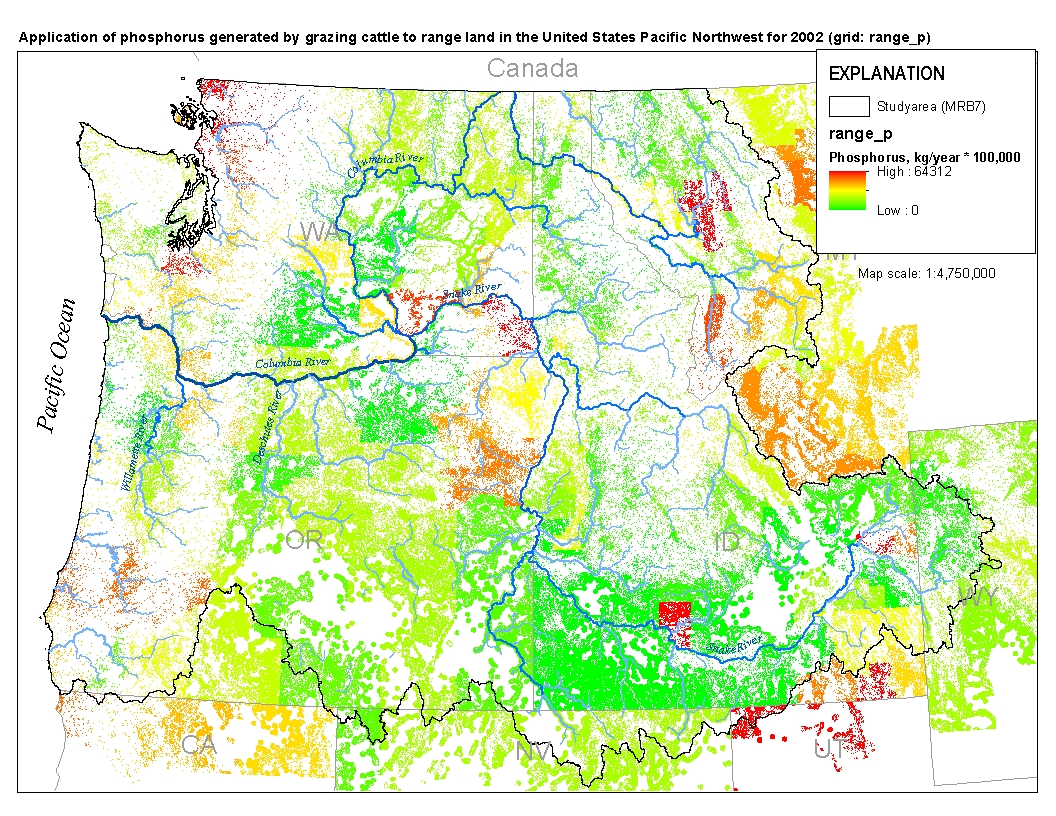
This spatial data set was created by the U.S. Geological Survey (USGS) to represent the amount of phosphorus generated by grazing cattle that was applied to range land in the Pacific Northwest region of the United States (Hydro Region 17; Major River Basin 7 (MRB7)) during 2002.
These datasets are one component of the multistressor studies conducted in Midwest streams in 2013 (MSQA) and in Southeast streams in 2014 (SESQA) by the U.S. Geological Survey National Water Quality Assessment Project. High-frequency small-volume autosamplers were deployed at 7 sites each in MSQA and SESQA that collected daily and weekly composite water samples, which were analyzed for 225 pesticides and pesticide degradates. Five of the MSQA autosampler sites were in agricultural watersheds and two in urban watersheds, whereas all seven SESQA autosampler sites were in urban watersheds. The daily and weekly composite samples were compared with results from traditional discrete water samples collected weekly at...
Types: Map Service,
OGC WFS Layer,
OGC WMS Layer,
OGC WMS Service;
Tags: Alabama,
Corn Belt,
Georgia,
Illinois,
Indiana,
Analytical recovery is the concentration of an analyte measured in a water-quality sample expressed as a percentage of the known concentration added to the sample (Mueller and others, 2015). Analytical recovery (hereafter referred to as “recovery”) can be used to understand method bias and variability and to assess the temporal changes in a method over time (Martin and others, 2009). This data set includes two tables: one table of field spike recovery data and one table of lab reagent spike recovery data. The table of field spike recovery data includes results from paired environmental and spike samples collected by the National Water Quality Program, National Water-Quality Assessment (NAWQA) Project in surface...
Categories: Data;
Tags: NAWQA,
National Water Quality Assessment,
National Water Quality Program,
USGS Science Data Catalog (SDC),
United States,
In 2013 to 2015, 833 public supply wells in 15 Principal aquifers in the United States were sampled to identify which aquifers contained high methane concentrations (>1 mg/L) and determine the geologic, hydrologic, and geochemical conditions associated with high concentrations. This study represents the first national assessment of methane in aquifers used for public supply in the U.S. and, as such, advances the understanding of the occurrence and distribution of methane in groundwater nationally. Methane concentrations >1 and >10 mg/L occurred in 6.7 and 1.1% of the samples, respectively. Most high concentrations occurred in aquifers in the Atlantic and Gulf Coastal Plain regions and upper Midwest. High methane...
High radium (Ra) concentrations in potable portions of the Cambrian-Ordovician (C-O) aquifer system were investigated using water-quality data and environmental tracers ( 3H, 3Hetrit, SF6 , 14C and 4Herad) of groundwater age from 80 public-supply wells (PSWs). Groundwater ages were estimated by calibration of tracers to lumped parameter models and ranged from modern (1 Myr) in the most downgradient, confined portions of the potable system. More than 80 and 40 percent of mean groundwater ages were older than 1000 and 50,000 yr, respectively. Anoxic, Fe-reducing conditions and increased mineralization develop with time in the aquifer system and mobilize Ra into solution resulting in the frequent occurrence of combined...
The location of a point (or pixel) within the conterminous U.S. can be assigned based on its position relative to the Nation’s stream network. Two metrics are recognized: lateral position (LP) and distance from stream to divide (DSD). And given that a point can have different positions in different hydrologic orders the term multi-order hydrologic position (MOHP) is used to describe the ensemble of hydrologic positions. LP and DSD were developed for nine hydrologic orders across the conterminous U.S. (Belitz and others, 2019; Moore and others, 2019). Four case studies are presented here that were used for evaluating the utility of MOHP in the context of random forest machine learning (Belitz and others, 2019)....
Categories: Data;
Tags: Central Valley, California,
Conterminous United States,
Cycle 3,
Fox-Wolf-Peshtigo,
Groundwater,
Chemical data from 43,334 wells were used to examine the role of land surface-soil-aquifer connections in producing elevated manganese concentrations (>300 µg/L) in United States (U.S.) groundwater. Elevated manganese and dissolved organic carbon (DOC) concentrations were associated with shallow water tables and organic-carbon rich soils, suggesting soil-derived DOC supported manganese reduction. Manganese and DOC concentrations were higher near rivers than farther from rivers, suggesting river-derived DOC also supported manganese reduction. Anthropogenic nitrogen may also affect manganese concentrations in groundwater. In parts of the northeastern U.S. containing poorly buffered soils, ~40% of the samples with...
Categories: Data;
Tags: Environmental Health,
Hydrogeology,
NAWQA,
National Water Quality Program,
USGS Science Data Catalog (SDC),
The Groundwater Usage for Public Supply dataset contains attributes pertaining to groundwater use in the glaciated conterminous United States summarized by county. The attributes were computed from total groundwater usage by county compiled by Maupin and others (2010), and from inventories of water-use records for 71,267 public water-supply systems by Buchwald and others (in press). Source aquifers (Quaternary sediments or bedrock) were assigned for the public water-supply systems based on reported data (e.g., well construction records, aquifer delineation maps), or based on well depth and the Quaternary sediment thickness. Water usage rates are reported on an average annual, areal basis in units of millimeters...
This data set is a national map of predicted probability of nitrate contamination of shallow ground waters based on a logistic regression (LR) model. The LR model was used to predict the probability of nitrate contamination exceeding 4 mg/L in predominantly shallow, recently recharged ground waters of the United States. The model contains variables representing (1) nitrogen (N) fertilizer loading, (2) percent cropland-pasture, (3) natural log of human population density, (4) percent well-drained soils, (5) depth to the seasonally high water table, and (6) presence or absence of unconsolidated sand and gravel aquifers. Observed and average predicted probabilities associated with deciles of risk are well correlated...
Data used to model and map manganese concentrations in groundwater in the Northern Atlantic Coastal Plain (NACP) aquifer system, eastern USA, are documented in this data release. The model predicts manganese concentration within four classes and is based on concentration data from 4492 wells. The well data were compiled from U.S. Geological Survey, U.S. Environmental Protection Agency, Suffolk County Water Authority (Suffolk County, New York), and state agency sources. The four concentration classes are based on guidelines for drinking water quality: below detection (class 1, less than 10 micrograms per liter (ug/L)); detected but less than the aesthetic guideline of 50 ug/L (class 2); greater than the aesthetic...

These data were released prior to the October 1, 2016 effective date for the USGS’s policy dictating the review, approval, and release of scientific data as referenced in USGS Survey Manual Chapter 502.8 Fundamental Science Practices: Review and Approval of Scientific Data for Release. The enhanced National Land Cover Data 1992 ("NLCDe 92") served as the primary source for nationally consistent mapped land cover during the first decade of sampling for the National Water-Quality Assessment (NAWQA) Program of the U.S. Geological Survey (USGS). This 30-meter (30-m) resolution digital map was developed by overlaying USGS's original satellite imagery-based 1992 National Land Cover Data ("NLCD 92") with selected classifications...

These data were released prior to the October 1, 2016 effective date for the USGS’s policy dictating the review, approval, and release of scientific data as referenced in USGS Survey Manual Chapter 502.8 Fundamental Science Practices: Review and Approval of Scientific Data for Release. This spatial data set was created by the U.S. Geological Survey (USGS) to represent mean annual solar radiation in the Pacific Northwest region of the United States (Hydro Region 17; Major River Basin 7 (MRB7)) for the period between 1991 and 2005 within each incremental watershed delineated in the NNHDPlus v2 dataset.

These data were released prior to the October 1, 2016 effective date for the USGS’s policy dictating the review, approval, and release of scientific data as referenced in USGS Survey Manual Chapter 502.8 Fundamental Science Practices: Review and Approval of Scientific Data for Release. This spatial data set was created by the U.S. Geological Survey (USGS) to represent the amount of nitrogen generated by grazing cattle that was applied to range land in the Pacific Northwest region of the United States (Hydro Region 17; Major River Basin 7 (MRB7)) during 2002.
|

|
