Filters: Tags: NPLCC (X) > partyWithName: North Pacific LCC Data Coordinator (X)
105 results (209ms)|
Filters
Date Range
Tag Schemes |

The geographic distribution of stream reaches with potential to support high quality habitat for salmonids has bearing on the actual status of habitats and populations over broad spatial extents. As part of the Coastal Landscape Analysis and Modeling Study (CLAMS), we examined how salmon-habitat potential was distributed relative to current and future (+100 years) landscape characteristics in the Coastal Province of Oregon, USA. The intrinsic potential to provide high-quality rearing habitat was modeled for juvenile coho salmon (Oncorhynchus kisutch) and juvenile steelhead (O. mykiss) based on stream flow, valley constraint, and stream gradient. Â See Supplemental Information for additional detail. BLM: (Bureau...

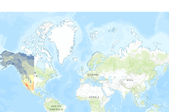
A comprehensive list of 38 categories of anthropogenic drivers of change in marine ecosystems developed through expert workshops (S1) was assessed for data availability on a global scale. We intentionally did not further subdivide these categories into unique drivers (e.g. each specific type of pollutant) as this would lead to over-emphasis of certain activities when impacts are summed. We limited our analyses to anthropogenic drivers with pre-existing global coverage or those for which we could assemble or develop global coverage. Although many regional-scale data and data with a global scope but incomplete coverage exist for a variety of specific human activities, inclusion of these data would bias global comparisons...

In the 2008 Red List assessment, a total of 75 extant and five extinct 'subpopulations' were identified across the natural range of O. nerka. In the 2011 amendment, several of these subpopulations were further subdivided based on additional input from salmon specialists (Pacific Salmon Commission, PSC, and Fisheries and Oceans Canada, DFO), resulting in a total of 98 subpopulations, of which 93 are extant. The subpopulations in this assessment are considered independent and reproductively isolated from each other. The assessors used a combination of ecoregional (i.e., marine and freshwater habitat-based) classification and the degree of genetic divergence between known spawning 'locations', using an FST value of...

This map service and the attached downloadable layer package represent OpenStreetMap (OSM) road data clipped to the Cascadia Partner Forum geography (with a 10km buffer). The data were obtained from WeoGeo, which converts OSM data from its native format to Esri formats (and others).  They last updated their database on May 1st, 2014. "OpenStreetMap is dedicated to created and providing geographic data, such as street maps, worldwide, for free. Most maps considered "free" actually have legal or technical restrictions on their use. These restrictions hold back anyone from using them in creative, productive or unexpected ways, and make every map a silo of data and effort. OSM's open license gives users the freedom...

Level 3 of the Global Lakes and Wetlands Database (GLWD) comprises lakes, reservoirs, rivers, and different wetland types in the form of a global raster map at 30-sec resolution.

This set of 4 rasters shows mean annual temperature (deg C * 10) for Western North America under the A2 Emissions Scenario from the Intergovernmental Panel on Climate Change (IPCC). One layer shows the historic period (1961 to 1990), and there are three layers of future climate projections representing the 2020s, the 2050s, and the 2080s. These future layers are ensemble averages across all 23 CMIP3 AOGCMs (Coupled Model Intercomparison Project 3 Atmosphere-Ocean General Circulation Models). All layers have a resolution of 1 km, and are designed to capture climate gradients, temperature inversions, and rain shadows in the mountainous landscape of western North America.

These data describe areas of suitable habitat believed to be used (currently and historically) by wild, natural, and/or hatchery fish populations. The term "currently" is defined as within the past five reproductive cycles. See the 'USETYPE' field description to differentiate between current and historic distribution. This information is based on extensive surveys, the best professional judgment of ODFW staff biologists and where possible, the professional opinions of staff from other natural resource agencies. Due to natural variations in run size, water conditions, or other environmental factors, some areas displayed may not be used by a species of fish on an annual basis. The Natural Resources Information Management...

This data set shows the locations of more than 3000 North American power-generating facilities using fossil fuel sources, and includes information on each plantâs primary fuel; the generating capacity; and the air emissions of SO2, NOx, Hg, PM2.5, PM10, CH4, N2O, and CO2. The data were assembled primarily from the three North American countriesâ national emission inventories: the National Pollutant Release Inventory (NPRI) in Canada; the National Emissions Inventory of Mexico (INEM), which is compiled from publicly available databases and reports; and the EPA emissions and Generation Resource Integrated Database (eGRID2007) and the EPA 2005 National Emissions Inventory (NEI) in the United States. These...
Subalpine Connectivity of areas of high elevation and high human footprint in the North Pacific Landscape Conservation Cooperative study area. This application provides Subalpine Connectivity for 2000 and 2080 (A1B). The North Pacific Forest Landscape Connectivity Project uses three main geospatial layers as inputs into the creation of resistance map grids.  One-km was decided as the resolution for the final resistance grids.  The three primary geospatial layers used in this analysis were a digital elevation model (DEM), a vegetation layer, and a human footprint layer.  Due to the geographic extent of the North Pacific Landscape Conservation Cooperative, digital elevation models from different sources had to...

Anthropogenic biomes. This dataset is a 5 arc minute thematic grid, prepared as described in WebPanel 1 of Ellis and Ramankutty (2008).

Derived from: Wild Salmon Center. 2008. Pacific Salmon Conservation Assessment: Vector digital data. Portland, OR: Wild Salmon Center. Depending on the data available for a catchment, ourabundance estimates came either directly from otherresearchersâ estimates of abundance or indirectly fromestimates of spawning adults, catch, harvest rates, ormultiple-regression equations we developed to predict abundance. This database, with citations, is available fromhttp://www.stanford.edu/?mpinsky/salmon/.We caution that our abundance estimates come frommany different sources in which a wide variety ofmethods were used, so they are rough approximationsrather than precise estimates. This is the nature ofdata available for...
This set of 4 rasters shows mean temperature of the warmest month (deg C * 10) for Western North America under the A2 Emissions Scenario from the Intergovernmental Panel on Climate Change (IPCC). One layer shows the historic period (1961 to 1990), and there are three layers of future climate projections representing the 2020s, the 2050s, and the 2080s. These future layers are ensemble averages across all 23 CMIP3 AOGCMs (Coupled Model Intercomparison Project 3 Atmosphere-Ocean General Circulation Models). All layers have a resolution of 1 km, and are designed to capture climate gradients, temperature inversions, and rain shadows in the mountainous landscape of western North America.
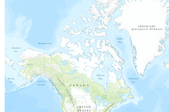
The National Hydro Network (NHN), for which the standard was officially adopted by the Canadian Council on Geomatics (CCOG) in August 2004, focuses on providing a quality geometric description and a set of basic attributes describing Canada's inland surface waters. It provides geospatial vector data describing hydrographic features such as lakes, reservoirs, rivers, streams, canals, islands, obstacles (e.g. waterfalls, rapids, rocks in water) and constructions (e.g. dams, wharves, dikes), as well as a linear drainage network and the toponymic information (geographical names) associated to hydrography.The NHN forms the hydrographic layer of the GeoBase. The best available federal and provincial/territorial data are...

Subalpine Connectivity of areas of low elevation and low human footprint in the North Pacific Landscape Conservation Cooperative study area. This application provides Subalpine Connectivity for 2000 and 2080 (A1B).The North Pacific Forest Landscape Connectivity Project uses three main geospatial layers as inputs into the creation of resistance map grids. One-km was decided as the resolution for the final resistance grids. The three primary geospatial layers used in this analysis were a digital elevation model (DEM), a vegetation layer, and a human footprint layer. Due to the geographic extent of the North Pacific Landscape Conservation Cooperative, digital elevation models from different sources had to be...

This set of 4 rasters shows mean temperature of the coldest month (deg C * 10) for Western North America under the A2 Emissions Scenario from the Intergovernmental Panel on Climate Change (IPCC). One layer shows the historic period (1961 to 1990), and there are three layers of future climate projections representing the 2020s, the 2050s, and the 2080s. These future layers are ensemble averages across all 23 CMIP3 AOGCMs (Coupled Model Intercomparison Project 3 Atmosphere-Ocean General Circulation Models). All layers have a resolution of 1 km, and are designed to capture climate gradients, temperature inversions, and rain shadows in the mountainous landscape of western North America.

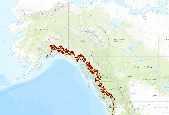
This service shows the Environmental Sensitivity Index (ESI) developed for the the outer coast of Washington in 1985. Both linear and polygonal shoreline features are included here. Associated GIS datasets can be downloaded here.ESI maps use shoreline rankings to rate how sensitive an area of shoreline would be to an oil spill. The ranking scale goes from 1 to 10.A rank of 1 represents shorelines with the least susceptibility to damage by oiling. Examples include steep, exposed rocky cliffs and banks. The oil cannot penetrate into the rock and will be washed off quickly by the waves and tides.A rank of 10 represents shorelines most likely to be damaged by oiling. Examples include protected, vegetated wetlands,...

This service shows the Environmental Sensitivity Index (ESI) developed for the Cook Inlet and Kenai Peninsula, AK, in 2002. Both linear and polygonal shoreline features are included here. Associated GIS datasets can be downloaded here.ESI maps use shoreline rankings to rate how sensitive an area of shoreline would be to an oil spill. The ranking scale goes from 1 to 10.A rank of 1 represents shorelines with the least susceptibility to damage by oiling. Examples include steep, exposed rocky cliffs and banks. The oil cannot penetrate into the rock and will be washed off quickly by the waves and tides.A rank of 10 represents shorelines most likely to be damaged by oiling. Examples include protected, vegetated...

This service shows the Environmental Sensitivity Index (ESI) developed for Price William Sound, AK, in 2000. Both linear and polygonal shoreline features are included here. Associated GIS datasets can be downloaded here.ESI maps use shoreline rankings to rate how sensitive an area of shoreline would be to an oil spill. The ranking scale goes from 1 to 10.A rank of 1 represents shorelines with the least susceptibility to damage by oiling. Examples include steep, exposed rocky cliffs and banks. The oil cannot penetrate into the rock and will be washed off quickly by the waves and tides.A rank of 10 represents shorelines most likely to be damaged by oiling. Examples include protected, vegetated wetlands, such...

Derived from: Wenger, Seth J.; Luce, Charles H.; Hamlet, Alan F.; Isaak, Daniel J.; Neville, Helen M. 2010. Macroscale hydrologic modeling of ecologically relevant flow metrics. Water Resources Research. 46: W09513. doi:10.1029/2009WR008839. Climate change is projected to alter the flow regimes of streams and rivers, with consequences for physical processes and aquatic organisms. To study these hydrologic changes, we have developed a database of flow metrics for streams in the western US (extent shown on the map to the left) under historical conditions and climate change scenarios. These are based on daily simulations of the Variable Infiltration Capacity (VIC) macroscale hydrologic model produced by the University...
Tags: NPLCC,
Stream Flow

This set of 4 rasters shows mean temperature of the coldest month (deg C * 10) for Western North America under the B1 Emissions Scenario from the Intergovernmental Panel on Climate Change (IPCC). One layer shows the historic period (1961 to 1990), and there are three layers of future climate projections representing the 2020s, the 2050s, and the 2080s. These future layers are ensemble averages across all 23 CMIP3 AOGCMs (Coupled Model Intercomparison Project 3 Atmosphere-Ocean General Circulation Models). All layers have a resolution of 1 km, and are designed to capture climate gradients, temperature inversions, and rain shadows in the mountainous landscape of western North America.
|

|
