Filters: Tags: Nantucket (X)
114 results (171ms)|
Filters
Date Range
Extensions Types Contacts
Categories Tag Types Tag Schemes |
The Geographic Names Information System (GNIS) is the Federal standard for geographic nomenclature. The U.S. Geological Survey developed the GNIS for the U.S. Board on Geographic Names, a Federal inter-agency body chartered by public law to maintain uniform feature name usage throughout the Government and to promulgate standard names to the public. The GNIS is the official repository of domestic geographic names data; the official vehicle for geographic names use by all departments of the Federal Government; and the source for applying geographic names to Federal electronic and printed products of all types.
This data set contains imagery from the National Agriculture Imagery Program (NAIP). The NAIP program is administered by USDA FSA and has been established to support two main FSA strategic goals centered on agricultural production. These are, increase stewardship of America's natural resources while enhancing the environment, and to ensure commodities are procured and distributed effectively and efficiently to increase food security. The NAIP program supports these goals by acquiring and providing ortho imagery that has been collected during the agricultural growing season in the U.S. The NAIP ortho imagery is tailored to meet FSA requirements and is a fundamental tool used to support FSA farm and conservation programs....
The Massachusetts Office of Coastal Zone Management launched the Shoreline Change Project in 1989 to identify erosion-prone areas of the coast. The shoreline position and change rate are used to inform management decisions regarding the erosion of coastal resources. In 2001, a shoreline from 1994 was added to calculate both long- and short-term shoreline change rates along ocean-facing sections of the Massachusetts coast. In 2013, two oceanfront shorelines for Massachusetts were added using 2008-9 color aerial orthoimagery and 2007 topographic lidar datasets obtained from the National Oceanic and Atmospheric Administration's Ocean Service, Coastal Services Center. This 2018 data release includes rates that incorporate...
Categories: Data;
Types: Downloadable,
Map Service,
OGC WFS Layer,
OGC WMS Layer,
Shapefile;
Tags: Accretion,
Atlantic Coast,
Baseline,
CMGP,
Coastal and Marine Geology Program,
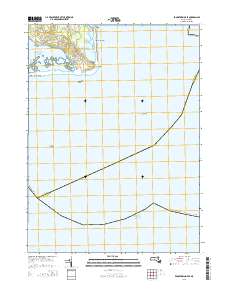
Layered GeoPDF 7.5 Minute Quadrangle Map. Layers of geospatial data include orthoimagery, roads, grids, geographic names, elevation contours, hydrography, and other selected map features.
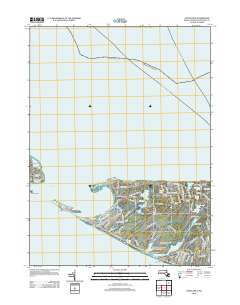
Layered GeoPDF 7.5 Minute Quadrangle Map. Layers of geospatial data include orthoimagery, roads, grids, geographic names, elevation contours, hydrography, and other selected map features.
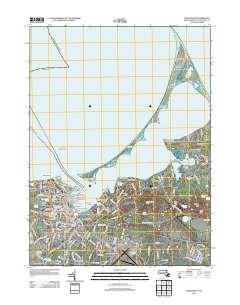
Layered GeoPDF 7.5 Minute Quadrangle Map. Layers of geospatial data include orthoimagery, roads, grids, geographic names, elevation contours, hydrography, and other selected map features.
The Massachusetts Office of Coastal Zone Management launched the Shoreline Change Project in 1989 to identify erosion-prone areas of the coast and support local land-use decisions. Trends of shoreline position over long and short-term timescales provide information to landowners, managers, and potential buyers about possible future impacts to coastal resources and infrastructure. In 2001, a 1994 shoreline was added to calculate both long- and short-term shoreline change rates along ocean-facing sections of the Massachusetts coast. In 2013 two oceanfront shorelines for Massachusetts were added using 2008-2009 color aerial orthoimagery and 2007 topographic lidar datasets obtained from NOAA's Ocean Service, Coastal...
Categories: Data;
Types: Downloadable,
Map Service,
OGC WFS Layer,
OGC WMS Layer,
Shapefile;
Tags: Atlantic Coast,
CMGP,
Coastal and Marine Geology Program,
DSAS,
Digital Shoreline Analysis System,
USGS Historical Quadrangle in GeoPDF.
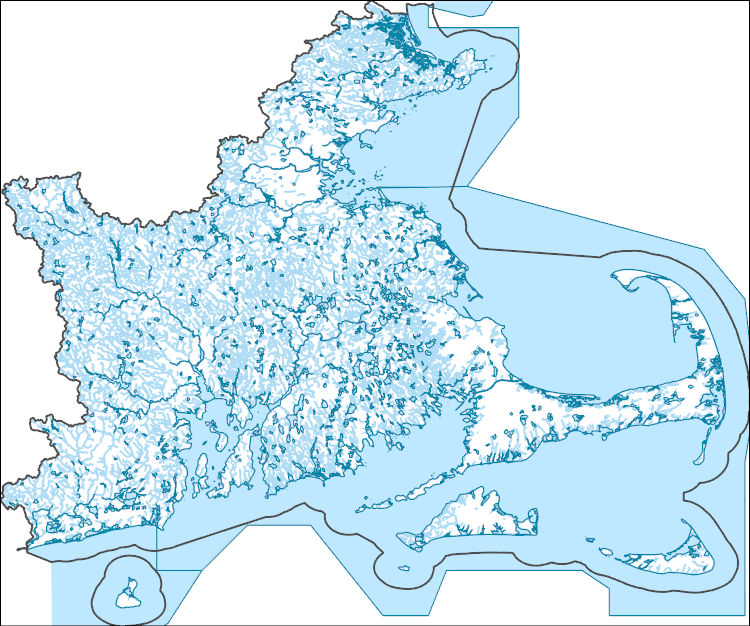
The National Hydrography Dataset (NHD) is a feature-based database that interconnects and uniquely identifies the stream segments or reaches that make up the nation's surface water drainage system. NHD data was originally developed at 1:100,000-scale and exists at that scale for the whole country. This high-resolution NHD, generally developed at 1:24,000/1:12,000 scale, adds detail to the original 1:100,000-scale NHD. (Data for Alaska, Puerto Rico and the Virgin Islands was developed at high-resolution, not 1:100,000 scale.) Local resolution NHD is being developed where partners and data exist. The NHD contains reach codes for networked features, flow direction, names, and centerline representations for areal water...

The Geographic Names Information System (GNIS) is the Federal standard for geographic nomenclature. The U.S. Geological Survey developed the GNIS for the U.S. Board on Geographic Names, a Federal inter-agency body chartered by public law to maintain uniform feature name usage throughout the Government and to promulgate standard names to the public. The GNIS is the official repository of domestic geographic names data; the official vehicle for geographic names use by all departments of the Federal Government; and the source for applying geographic names to Federal electronic and printed products of all types.

The National Hydrography Dataset (NHD) is a feature-based database that interconnects and uniquely identifies the stream segments or reaches that make up the nation's surface water drainage system. NHD data was originally developed at 1:100,000-scale and exists at that scale for the whole country. This high-resolution NHD, generally developed at 1:24,000/1:12,000 scale, adds detail to the original 1:100,000-scale NHD. (Data for Alaska, Puerto Rico and the Virgin Islands was developed at high-resolution, not 1:100,000 scale.) Local resolution NHD is being developed where partners and data exist. The NHD contains reach codes for networked features, flow direction, names, and centerline representations for areal water...
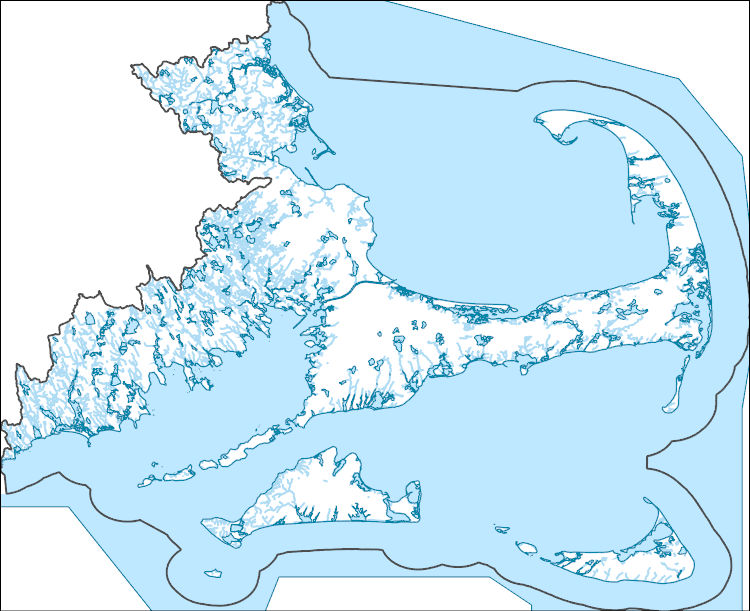
The National Hydrography Dataset (NHD) is a feature-based database that interconnects and uniquely identifies the stream segments or reaches that make up the nation's surface water drainage system. NHD data was originally developed at 1:100,000-scale and exists at that scale for the whole country. This high-resolution NHD, generally developed at 1:24,000/1:12,000 scale, adds detail to the original 1:100,000-scale NHD. (Data for Alaska, Puerto Rico and the Virgin Islands was developed at high-resolution, not 1:100,000 scale.) Local resolution NHD is being developed where partners and data exist. The NHD contains reach codes for networked features, flow direction, names, and centerline representations for areal water...
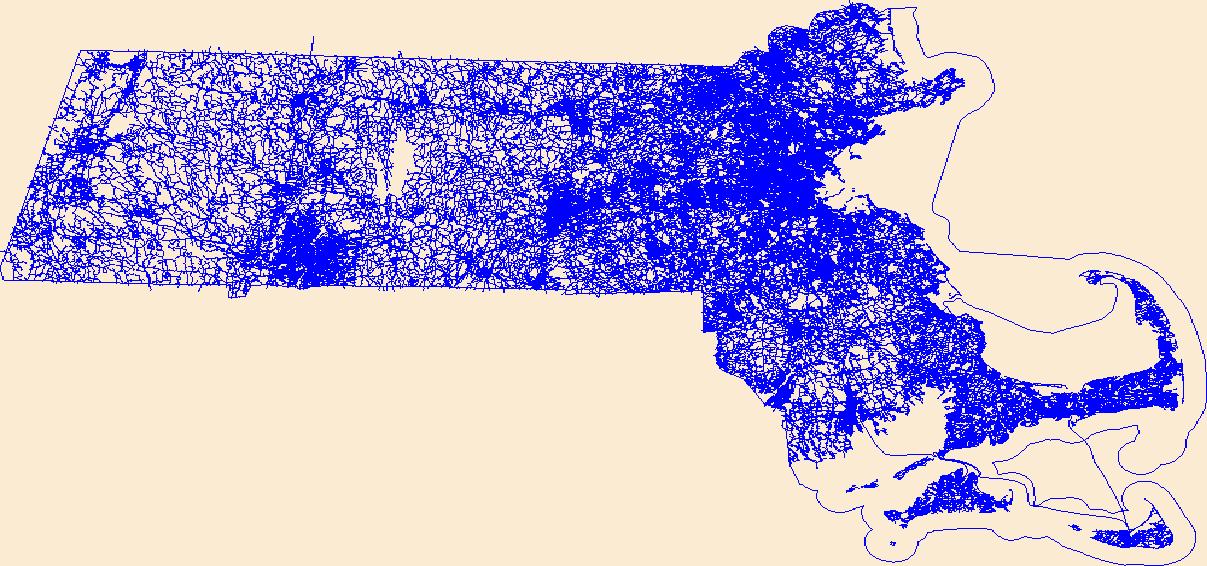
Layers of geospatial data include roads, airports, trails, and railroads.
Geologic, sediment texture, and physiographic zone maps characterize the sea floor south and west of Martha's Vineyard and north of Nantucket, Massachusetts. These maps were derived from interpretations of seismic-reflection profiles, high-resolution bathymetry, acoustic-backscatter intensity, bottom photographs, and surficial sediment samples. The interpretation of the seismic stratigraphy and mapping of glacial and Holocene marine units provided a foundation on which the surficial maps were created. This mapping is a result of a collaborative effort between the U.S. Geological Survey and the Massachusetts Office of Coastal Zone Management to characterize the surface and subsurface geologic framework offshore of...
Categories: Data;
Types: Downloadable,
Map Service,
OGC WFS Layer,
OGC WMS Layer,
Shapefile;
Tags: 3200,
424,
512i,
Aquinnah,
Atlantic Ocean,
Geologic, sediment texture, and physiographic zone maps characterize the sea floor south and west of Martha's Vineyard and north of Nantucket, Massachusetts. These maps were derived from interpretations of seismic-reflection profiles, high-resolution bathymetry, acoustic-backscatter intensity, bottom photographs, and surficial sediment samples. The interpretation of the seismic stratigraphy and mapping of glacial and Holocene marine units provided a foundation on which the surficial maps were created. This mapping is a result of a collaborative effort between the U.S. Geological Survey and the Massachusetts Office of Coastal Zone Management to characterize the surface and subsurface geologic framework offshore of...
Categories: Data;
Types: Downloadable,
Map Service,
OGC WFS Layer,
OGC WMS Layer,
Shapefile;
Tags: Aquinnah,
Atlantic Ocean,
Backscatter,
Bathymetry,
CMGP,
The Massachusetts Office of Coastal Zone Management launched the Shoreline Change Project in 1989 to identify erosion-prone areas of the coast. The shoreline position and change rate are used to inform management decisions regarding the erosion of coastal resources. In 2001, a shoreline from 1994 was added to calculate both long- and short-term shoreline change rates along ocean-facing sections of the Massachusetts coast. In 2013, two oceanfront shorelines for Massachusetts were added using 2008-9 color aerial orthoimagery and 2007 topographic lidar datasets obtained from the National Oceanic and Atmospheric Administration's Ocean Service, Coastal Services Center. This 2018 data release includes rates that incorporate...
Categories: Data;
Types: Downloadable,
Map Service,
OGC WFS Layer,
OGC WMS Layer,
Shapefile;
Tags: Atlantic Coast,
Baseline,
CMGP,
Coastal and Marine Geology Program,
DSAS,
The Massachusetts Office of Coastal Zone Management launched the Shoreline Change Project in 1989 to identify erosion-prone areas of the coast. The shoreline position and change rate are used to inform management decisions regarding the erosion of coastal resources. In 2001, a shoreline from 1994 was added to calculate both long- and short-term shoreline change rates along ocean-facing sections of the Massachusetts coast. In 2013, two oceanfront shorelines for Massachusetts were added using 2008-9 color aerial orthoimagery and 2007 topographic lidar datasets obtained from the National Oceanic and Atmospheric Administration's Ocean Service, Coastal Services Center. This 2018 data release includes rates that incorporate...
This data set contains imagery from the National Agriculture Imagery Program (NAIP). The NAIP program is administered by USDA FSA and has been established to support two main FSA strategic goals centered on agricultural production. These are, increase stewardship of America's natural resources while enhancing the environment, and to ensure commodities are procured and distributed effectively and efficiently to increase food security. The NAIP program supports these goals by acquiring and providing ortho imagery that has been collected during the agricultural growing season in the U.S. The NAIP ortho imagery is tailored to meet FSA requirements and is a fundamental tool used to support FSA farm and conservation programs....
This data set contains imagery from the National Agriculture Imagery Program (NAIP). The NAIP program is administered by USDA FSA and has been established to support two main FSA strategic goals centered on agricultural production. These are, increase stewardship of America's natural resources while enhancing the environment, and to ensure commodities are procured and distributed effectively and efficiently to increase food security. The NAIP program supports these goals by acquiring and providing ortho imagery that has been collected during the agricultural growing season in the U.S. The NAIP ortho imagery is tailored to meet FSA requirements and is a fundamental tool used to support FSA farm and conservation programs....
Layered GeoPDF 7.5 Minute Quadrangle Map. Layers of geospatial data include orthoimagery, roads, grids, geographic names, elevation contours, hydrography, and other selected map features.
|

|
