Filters: Tags: Nantucket (X)
114 results (13ms)|
Filters
Date Range
Extensions Types Contacts
Categories Tag Types Tag Schemes |
This data set contains imagery from the National Agriculture Imagery Program (NAIP). The NAIP program is administered by USDA FSA and has been established to support two main FSA strategic goals centered on agricultural production. These are, increase stewardship of America's natural resources while enhancing the environment, and to ensure commodities are procured and distributed effectively and efficiently to increase food security. The NAIP program supports these goals by acquiring and providing ortho imagery that has been collected during the agricultural growing season in the U.S. The NAIP ortho imagery is tailored to meet FSA requirements and is a fundamental tool used to support FSA farm and conservation programs....
The Massachusetts Office of Coastal Zone Management launched the Shoreline Change Project in 1989 to identify erosion-prone areas of the coast. The shoreline position and change rate are used to inform management decisions regarding the erosion of coastal resources. In 2001, a shoreline from 1994 was added to calculate both long- and short-term shoreline change rates along ocean-facing sections of the Massachusetts coast. In 2013, two oceanfront shorelines for Massachusetts were added using 2008-9 color aerial orthoimagery and 2007 topographic lidar datasets obtained from the National Oceanic and Atmospheric Administration's Ocean Service, Coastal Services Center. This 2018 data release includes rates that incorporate...
Categories: Data;
Types: Downloadable,
Map Service,
OGC WFS Layer,
OGC WMS Layer,
Shapefile;
Tags: Atlantic Coast,
CMGP,
Coastal and Marine Geology Program,
DSAS,
Digital Shoreline Analysis System,
Two marine geological surveys were conducted in Nantucket Sound, Massachusetts, in May 2016 and May 2017 by the U.S. Geological Survey as part of an agreement with the Massachusetts Office of Coastal Zone Management to map the geology of the sea floor offshore of Massachusetts. Samples of surficial sediment and photographs of the sea floor were collected at 76 sampling sites within the survey area, and sea-floor videos were collected at 75 of the sites. The sediment data and the observations from the photos and videos are used to explore the nature of the sea floor; in conjunction with high-resolution geophysical data, the observations are used to make interpretive maps of sedimentary environments and validate acoustic...
Types: Map Service,
OGC WFS Layer,
OGC WMS Layer,
OGC WMS Service;
Tags: Atlantic Ocean,
Marine Geology,
Massachusetts,
Nantucket,
Nantucket Sound,
Two marine geological surveys were conducted in Nantucket Sound, Massachusetts, in May 2016 and May 2017 by the U.S. Geological Survey as part of an agreement with the Massachusetts Office of Coastal Zone Management to map the geology of the sea floor offshore of Massachusetts. Samples of surficial sediment and photographs of the sea floor were collected at 76 sampling sites within the survey area, and sea-floor videos were collected at 75 of the sites. The sediment data and the observations from the photos and videos are used to explore the nature of the sea floor; in conjunction with high-resolution geophysical data, the observations are used to make interpretive maps of sedimentary environments and validate acoustic...
Categories: Data;
Types: Downloadable,
Map Service,
OGC WFS Layer,
OGC WMS Layer,
Shapefile;
Tags: Atlantic Ocean,
CMHRP,
CSV,
CZM,
Coastal and Marine Hazards and Resources Program,
Geologic, sediment texture, and physiographic zone maps characterize the sea floor south and west of Martha's Vineyard and north of Nantucket, Massachusetts. These maps were derived from interpretations of seismic-reflection profiles, high-resolution bathymetry, acoustic-backscatter intensity, bottom photographs, and surficial sediment samples. The interpretation of the seismic stratigraphy and mapping of glacial and Holocene marine units provided a foundation on which the surficial maps were created. This mapping is a result of a collaborative effort between the U.S. Geological Survey and the Massachusetts Office of Coastal Zone Management to characterize the surface and subsurface geologic framework offshore of...
Categories: Data;
Types: Downloadable,
Map Service,
OGC WFS Layer,
OGC WMS Layer,
Shapefile;
Tags: Aquinnah,
Atlantic Ocean,
Backscatter,
Bathymetry,
Bottom Photographs,
The Massachusetts Office of Coastal Zone Management launched the Shoreline Change Project in 1989 to identify erosion-prone areas of the coast. The shoreline position and change rate are used to inform management decisions regarding the erosion of coastal resources. In 2001, a 1994 shoreline was added to calculate both long- and short-term shoreline change rates at 40-meter intervals along ocean-facing sections of the Massachusetts coast. In 2013 two oceanfront shorelines for Massachusetts were added using 2008-2009 color aerial orthoimagery and 2007 topographic lidar datasets obtained from NOAA's Ocean Service, Coastal Services Center. This 2018 update includes two new mean high water (MHW) shorelines for the Massachusetts...
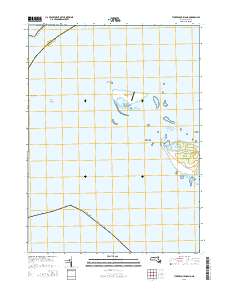
Layered GeoPDF 7.5 Minute Quadrangle Map. Layers of geospatial data include orthoimagery, roads, grids, geographic names, elevation contours, hydrography, and other selected map features.
The Digital Shoreline Analysis System (DSAS) is a freely available software application that works within the Environmental Systems Research Institute (ESRI) Geographic Information System (ArcGIS) software. DSAS computes rate-of-change statistics for a time series of shoreline vector data. Additionally, the DSAS application is useful for computing rates of change for any boundary-change problem that incorporates a clearly-identified feature position at discrete times, such as glacier limits, river banks, or land use/cover boundaries. The "bias feature" is a shapefile representation the proxy-datum bias (PDB) data previously published in tabular format (Himmelstoss and others 2010, Himmelstoss and others 2018). These...
Categories: Data;
Types: Downloadable,
Map Service,
OGC WFS Layer,
OGC WMS Layer,
Shapefile;
Tags: Atlantic Coast,
Boston,
Buzzard’s Bay,
CMGP,
CSC,
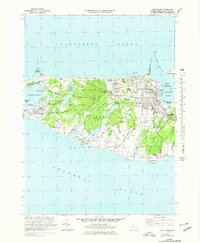
USGS Historical Quadrangle in GeoPDF.
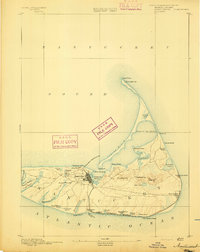
USGS Historical Quadrangle in GeoPDF.
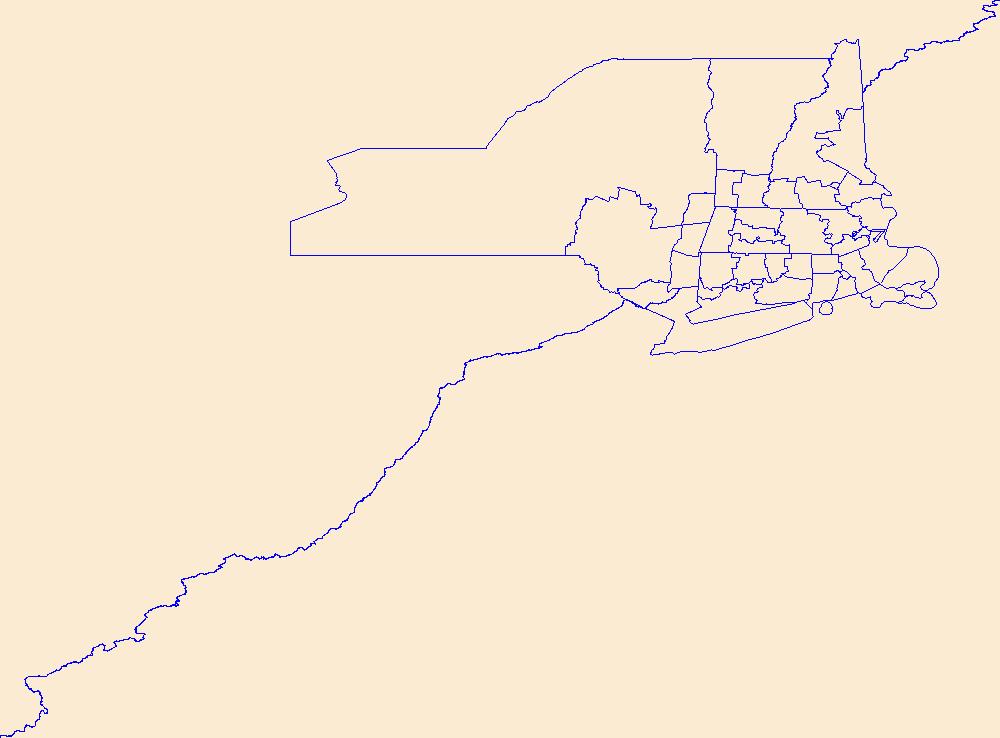
Geospatial data is comprised of government boundaries.
This data set contains imagery from the National Agriculture Imagery Program (NAIP). The NAIP program is administered by USDA FSA and has been established to support two main FSA strategic goals centered on agricultural production. These are, increase stewardship of America's natural resources while enhancing the environment, and to ensure commodities are procured and distributed effectively and efficiently to increase food security. The NAIP program supports these goals by acquiring and providing ortho imagery that has been collected during the agricultural growing season in the U.S. The NAIP ortho imagery is tailored to meet FSA requirements and is a fundamental tool used to support FSA farm and conservation programs....
This data set contains imagery from the National Agriculture Imagery Program (NAIP). The NAIP program is administered by USDA FSA and has been established to support two main FSA strategic goals centered on agricultural production. These are, increase stewardship of America's natural resources while enhancing the environment, and to ensure commodities are procured and distributed effectively and efficiently to increase food security. The NAIP program supports these goals by acquiring and providing ortho imagery that has been collected during the agricultural growing season in the U.S. The NAIP ortho imagery is tailored to meet FSA requirements and is a fundamental tool used to support FSA farm and conservation programs....
Integrated terrain models covering 16,357 square kilometers of the Massachusetts coastal zone and offshore waters were built to provide a continuous elevation and bathymetry terrain model for ocean planning purposes. The area is divided into the following four geographical areas to reduce file size and facilitate publishing: Massachusetts Bay from the Massachusetts-New Hampshire border south to Provincetown and Scituate and east to Stellwagen Bank; Cape Cod Bay from Provincetown to Scituate and south to Hyannis; Buzzards Bay from the Cape Cod Canal southwest to the State border including the Elizabeth Islands and extending north to Fall River and Mount Hope Bay; and Nantucket and Vineyard Sounds, from Hyannis south...
Geologic, sediment texture, and physiographic zone maps characterize the sea floor south and west of Martha's Vineyard and north of Nantucket, Massachusetts. These maps were derived from interpretations of seismic-reflection profiles, high-resolution bathymetry, acoustic-backscatter intensity, bottom photographs, and surficial sediment samples. The interpretation of the seismic stratigraphy and mapping of glacial and Holocene marine units provided a foundation on which the surficial maps were created. This mapping is a result of a collaborative effort between the U.S. Geological Survey and the Massachusetts Office of Coastal Zone Management to characterize the surface and subsurface geologic framework offshore of...
Categories: Data;
Types: Downloadable,
GeoTIFF,
Map Service,
Raster;
Tags: Aquinnah,
Atlantic Ocean,
CMGP,
CZM,
Cape Cod,
The Massachusetts Office of Coastal Zone Management launched the Shoreline Change Project in 1989 to identify erosion-prone areas of the coast. The shoreline position and change rate are used to inform management decisions regarding the erosion of coastal resources. In 2001, a 1994 shoreline was added to calculate both long- and short-term shoreline change rates at 40-meter intervals along ocean-facing sections of the Massachusetts coast. In 2013 two oceanfront shorelines for Massachusetts were added using 2008-2009 color aerial orthoimagery and 2007 topographic lidar datasets obtained from NOAA's Ocean Service, Coastal Services Center. This 2018 update includes two new mean high water (MHW) shorelines for the Massachusetts...
Categories: Data;
Types: Downloadable,
Map Service,
OGC WFS Layer,
OGC WMS Layer,
Shapefile;
Tags: Atlantic Coast,
Coastal and Marine Geology Program,
DSAS,
Database IV format,
Digital Shoreline Analysis System,
Layered GeoPDF 7.5 Minute Quadrangle Map. Layers of geospatial data include orthoimagery, roads, grids, geographic names, elevation contours, hydrography, and other selected map features.
Layered GeoPDF 7.5 Minute Quadrangle Map. Layers of geospatial data include orthoimagery, roads, grids, geographic names, elevation contours, hydrography, and other selected map features.
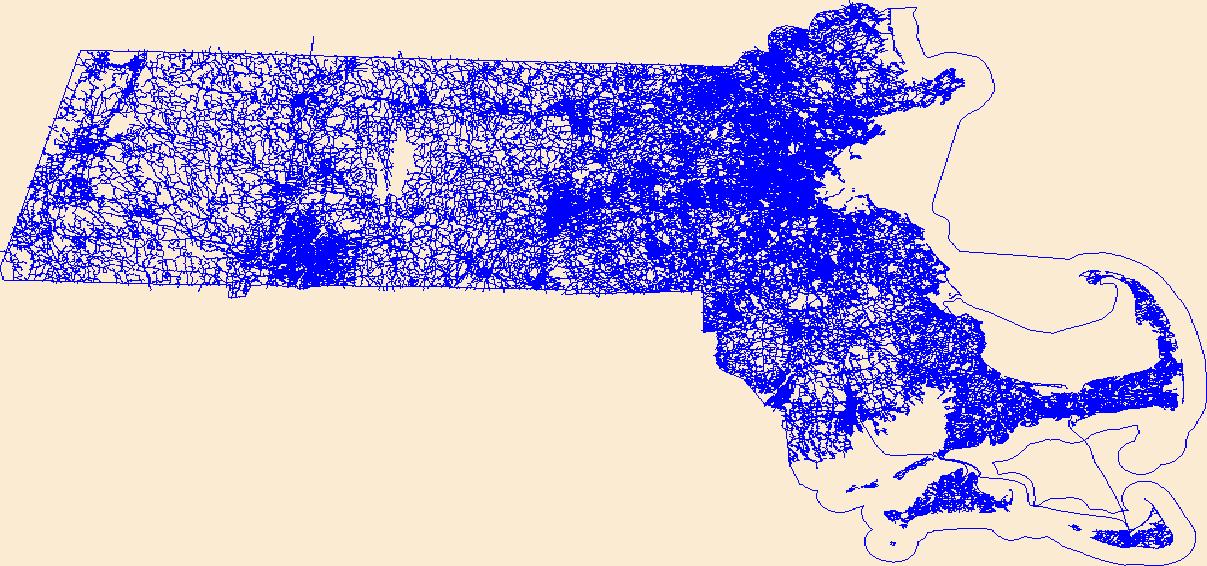
Layers of geospatial data include roads, airports, trails, and railroads.
|

|
