Filters: Tags: Napa County (X)
213 results (101ms)|
Filters
Contacts
(Less)
|
This product is the result of a comprehensive compilation of site-specific ground photographs taken where tectonic faulting and ground failure produced visible deformation that fractured and disturbed the ground surface. The resultant data is distributed as a tab-delimited text file. All post-earthquake photographs taken by investigators working for public agencies are in the public domain, including data that have been published in summary reports elsewhere.
Hillshade of lidar-derived, bare earth digital elevation model, with 235-degree azimuth and 20-degree sun angle, 0.25m resolution, depicting earthquake effects following the August 24, 2014 South Napa Earthquake.
Categories: Data;
Types: Citation,
Downloadable,
GeoTIFF,
Map Service,
Raster;
Tags: California,
Napa,
Napa County,
San Francisco Bay,
earthquake occurrences,
This product is the result of a comprehensive compilation of site-specific ground photographs taken where tectonic faulting and ground failure produced visible deformation that fractured and disturbed the ground surface. The resultant data is distributed as collection of JPEG image files. All post-earthquake photographs taken by investigators working for public agencies are in the public domain, including data that have been published in summary reports elsewhere. These photographs are best viewed in context with fault rupture and other observations from the related KMZ file of summary field observations and photographs (https://www.sciencebase.gov/catalog/item/5c1d7ae0e4b0708288ca1322), or from the associated open-file...
This dataset consists of 42 magnetotelluric (MT) stations collected in 2017 in the Northwest Geysers, CA. The U.S. Geological Survey acquired these data as part of a project to image the heat source in the Northwest Geysers. Support was from the U.S. Geological Survey's Volcano Hazards Program.
This dataset consists of 42 magnetotelluric (MT) stations collected in 2017 in the Northwest Geysers, CA. The U.S. Geological Survey acquired these data as part of a project to image the heat source in the Northwest Geysers. Support was from the U.S. Geological Survey's Volcano Hazards Program.
This dataset consists of 42 magnetotelluric (MT) stations collected in 2017 in the Northwest Geysers, CA. The U.S. Geological Survey acquired these data as part of a project to image the heat source in the Northwest Geysers. Support was from the U.S. Geological Survey's Volcano Hazards Program.
This dataset consists of 42 magnetotelluric (MT) stations collected in 2017 in the Northwest Geysers, CA. The U.S. Geological Survey acquired these data as part of a project to image the heat source in the Northwest Geysers. Support was from the U.S. Geological Survey's Volcano Hazards Program.
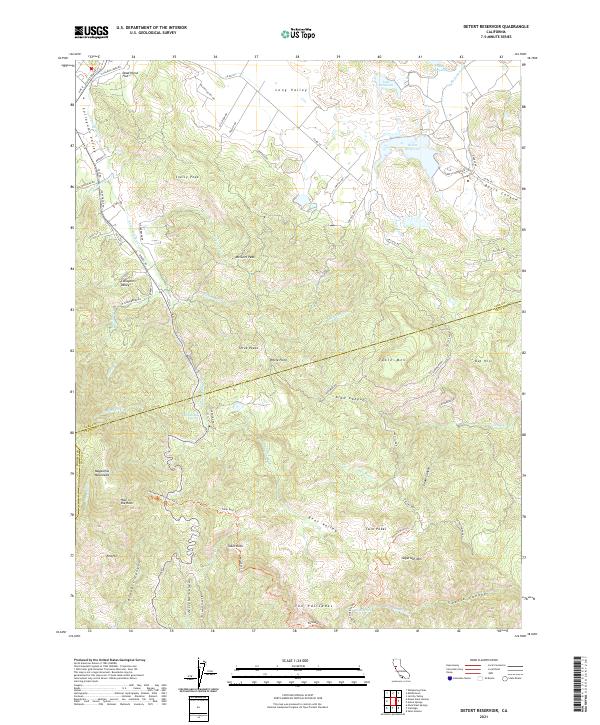
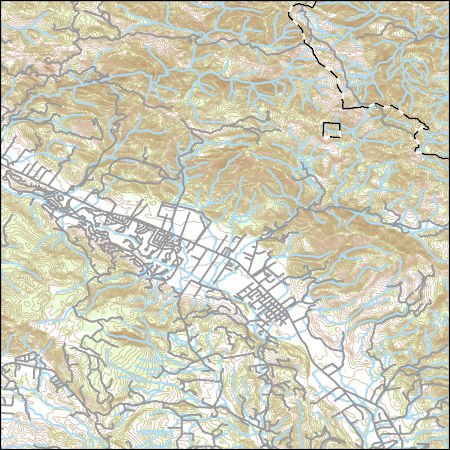
Layered geospatial PDF 7.5 Minute Quadrangle Map. Layers of geospatial data include orthoimagery, roads, grids, geographic names, elevation contours, hydrography, and other selected map features. This map is derived from GIS (geospatial information system) data. It represents a repackaging of GIS data in traditional map form, not creation of new information. The geospatial data in this map are from selected National Map data holdings and other government sources.
Layered geospatial PDF 7.5 Minute Quadrangle Map. Layers of geospatial data include orthoimagery, roads, grids, geographic names, elevation contours, hydrography, and other selected map features. This map is derived from GIS (geospatial information system) data. It represents a repackaging of GIS data in traditional map form, not creation of new information. The geospatial data in this map are from selected National Map data holdings and other government sources.
Layered geospatial PDF 7.5 Minute Quadrangle Map. Layers of geospatial data include orthoimagery, roads, grids, geographic names, elevation contours, hydrography, and other selected map features. This map is derived from GIS (geospatial information system) data. It represents a repackaging of GIS data in traditional map form, not creation of new information. The geospatial data in this map are from selected National Map data holdings and other government sources.
Layered geospatial PDF 7.5 Minute Quadrangle Map. Layers of geospatial data include orthoimagery, roads, grids, geographic names, elevation contours, hydrography, and other selected map features. This map is derived from GIS (geospatial information system) data. It represents a repackaging of GIS data in traditional map form, not creation of new information. The geospatial data in this map are from selected National Map data holdings and other government sources.
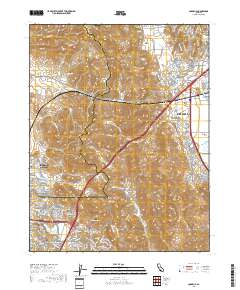
Layered geospatial PDF 7.5 Minute Quadrangle Map. Layers of geospatial data include orthoimagery, roads, grids, geographic names, elevation contours, hydrography, and other selected map features. This map is derived from GIS (geospatial information system) data. It represents a repackaging of GIS data in traditional map form, not creation of new information. The geospatial data in this map are from selected National Map data holdings and other government sources.

These data were released prior to the October 1, 2016 effective date for the USGS’s policy dictating the review, approval, and release of scientific data as referenced in USGS Survey Manual Chapter 502.8 Fundamental Science Practices: Review and Approval of Scientific Data for Release. This digital dataset defines the spring 1961 water-table altitude for the California's Central Valley. It was used to initiate the water-level altitudes for the upper zones of the transient hydrologic model of the Central Valley flow system. The Central Valley encompasses an approximate 50,000 square-kilometer region of California. The complex hydrologic system of the Central Valley is simulated using the USGS numerical modeling...

These data were released prior to the October 1, 2016 effective date for the USGS’s policy dictating the review, approval, and release of scientific data as referenced in USGS Survey Manual Chapter 502.8 Fundamental Science Practices: Review and Approval of Scientific Data for Release. This digital dataset defines the model grid and altitudes of the top of the 10 model layers and base of the model simulated in the transient hydrologic model of the Central Valley flow system. The Central Valley encompasses an approximate 50,000 square-kilometer region of California. The complex hydrologic system of the Central Valley is simulated using the USGS numerical modeling code MODFLOW-FMP (Schmid and others, 2006), which...

These data were released prior to the October 1, 2016 effective date for the USGS’s policy dictating the review, approval, and release of scientific data as referenced in USGS Survey Manual Chapter 502.8 Fundamental Science Practices: Review and Approval of Scientific Data for Release. This digital dataset contains the surface-water network for the Central Valley Hydrologic Model (CVHM). The Central Valley encompasses an approximate 50,000-square-kilometer region of California. The complex hydrologic system of the Central Valley is simulated using the USGS numerical modeling code MODFLOW-FMP (Schmid and others, 2006). This simulation is referred to here as the CVHM (Faunt, 2009). Utilizing MODFLOW-FMP, the CVHM...
This data release is currently being revised and is temporarily unavailable. Please contact rhkent@usgs.gov with any immediate requests. The U.S. Geological Survey Groundwater Ambient Monitoring and Assessment-Priority Basin Project (USGS GAMA-PBP) collected samples to be analyzed for per-and polyfluoroalkyl substances (PFAS) from domestic and public supply wells from May 2019 to September 2020. The datasets presented here include identification of the 28 PFAS constituents monitored by the project, Identification and brief characterization of the 211 GAMA-PBP wells for which samples were analyzed for PFAS during the study period, and analytical results for those groundwater samples, along with results for quality...
Categories: Data;
Tags: California,
Colusa County,
Environmental Health,
Geochemistry,
Humboldt County,
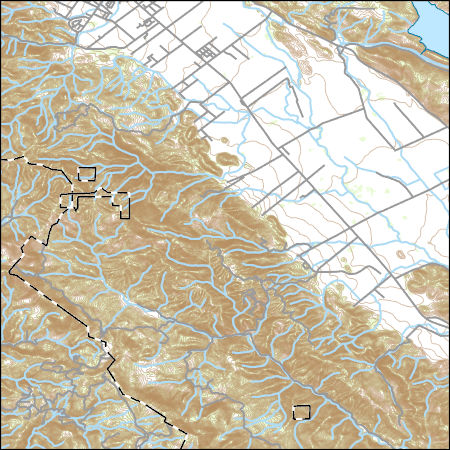
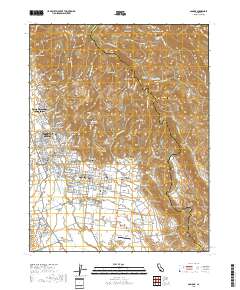
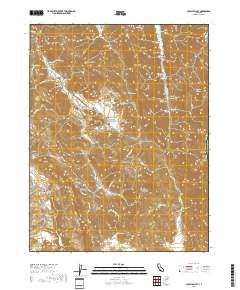
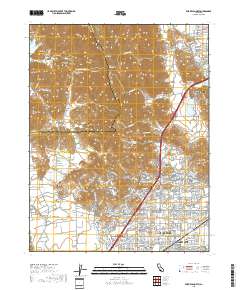
Layers of geospatial data include contours, boundaries, land cover, hydrography, roads, transportation, geographic names, structures, and other selected map features.
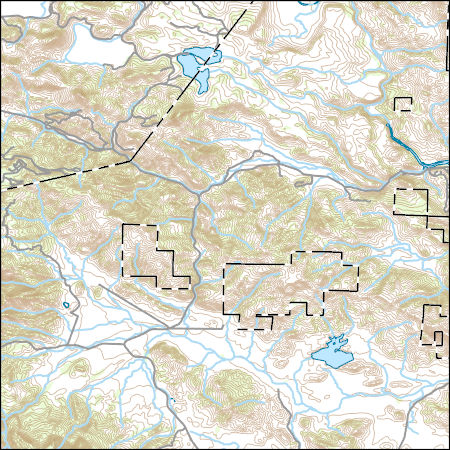
Layers of geospatial data include contours, boundaries, land cover, hydrography, roads, transportation, geographic names, structures, and other selected map features.
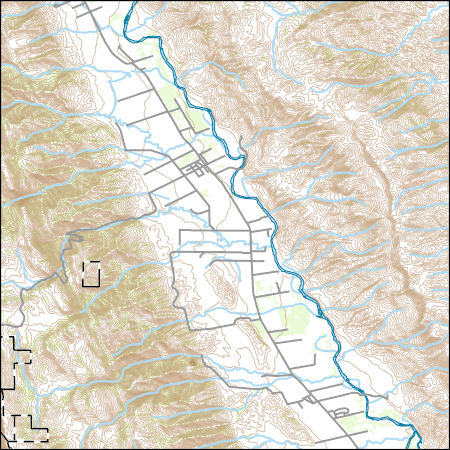
Layers of geospatial data include contours, boundaries, land cover, hydrography, roads, transportation, geographic names, structures, and other selected map features.
Layers of geospatial data include contours, boundaries, land cover, hydrography, roads, transportation, geographic names, structures, and other selected map features.
|

|
