Filters: Tags: Nevada (X) > Types: Citation (X)
4,450 results (16ms)|
Filters
Date Range
Extensions
Types Contacts
Categories Tag Types
|
This data set contains imagery from the National Agriculture Imagery Program (NAIP). The NAIP program is administered by USDA FSA and has been established to support two main FSA strategic goals centered on agricultural production. These are, increase stewardship of America's natural resources while enhancing the environment, and to ensure commodities are procured and distributed effectively and efficiently to increase food security. The NAIP program supports these goals by acquiring and providing ortho imagery that has been collected during the agricultural growing season in the U.S. The NAIP ortho imagery is tailored to meet FSA requirements and is a fundamental tool used to support FSA farm and conservation programs....
This data set contains imagery from the National Agriculture Imagery Program (NAIP). The NAIP program is administered by USDA FSA and has been established to support two main FSA strategic goals centered on agricultural production. These are, increase stewardship of America's natural resources while enhancing the environment, and to ensure commodities are procured and distributed effectively and efficiently to increase food security. The NAIP program supports these goals by acquiring and providing ortho imagery that has been collected during the agricultural growing season in the U.S. The NAIP ortho imagery is tailored to meet FSA requirements and is a fundamental tool used to support FSA farm and conservation programs....
This data set contains imagery from the National Agriculture Imagery Program (NAIP). The NAIP program is administered by USDA FSA and has been established to support two main FSA strategic goals centered on agricultural production. These are, increase stewardship of America's natural resources while enhancing the environment, and to ensure commodities are procured and distributed effectively and efficiently to increase food security. The NAIP program supports these goals by acquiring and providing ortho imagery that has been collected during the agricultural growing season in the U.S. The NAIP ortho imagery is tailored to meet FSA requirements and is a fundamental tool used to support FSA farm and conservation programs....
This data set contains imagery from the National Agriculture Imagery Program (NAIP). The NAIP program is administered by USDA FSA and has been established to support two main FSA strategic goals centered on agricultural production. These are, increase stewardship of America's natural resources while enhancing the environment, and to ensure commodities are procured and distributed effectively and efficiently to increase food security. The NAIP program supports these goals by acquiring and providing ortho imagery that has been collected during the agricultural growing season in the U.S. The NAIP ortho imagery is tailored to meet FSA requirements and is a fundamental tool used to support FSA farm and conservation programs....
This data set contains imagery from the National Agriculture Imagery Program (NAIP). The NAIP program is administered by USDA FSA and has been established to support two main FSA strategic goals centered on agricultural production. These are, increase stewardship of America's natural resources while enhancing the environment, and to ensure commodities are procured and distributed effectively and efficiently to increase food security. The NAIP program supports these goals by acquiring and providing ortho imagery that has been collected during the agricultural growing season in the U.S. The NAIP ortho imagery is tailored to meet FSA requirements and is a fundamental tool used to support FSA farm and conservation programs....
This data set contains imagery from the National Agriculture Imagery Program (NAIP). The NAIP program is administered by USDA FSA and has been established to support two main FSA strategic goals centered on agricultural production. These are, increase stewardship of America's natural resources while enhancing the environment, and to ensure commodities are procured and distributed effectively and efficiently to increase food security. The NAIP program supports these goals by acquiring and providing ortho imagery that has been collected during the agricultural growing season in the U.S. The NAIP ortho imagery is tailored to meet FSA requirements and is a fundamental tool used to support FSA farm and conservation programs....
Future climates are simulated by general circulation models (GCM) using climate change scenarios (IPCC 2014). To project climate change for the sagebrush biome, we used 11 GCMs and two climate change scenarios from the IPCC Fifth Assessment, representative concentration pathways (RCPs) 4.5 and 8.5 (Moss et al. 2010, Van Vuuren et al. 2011). RCP4.5 scenario represents a future where climate policies limit and achieve stabilization of greenhouse gas concentrations to 4.5 W m-2 by 2100. RCP8.5 scenario might be called a business-as-usual scenario, where high emissions of greenhouse gases continue in the absence of climate change policies. The two selected time frames allow comparison of near-term (2020-2050) and longer-term...
Categories: Data;
Types: Citation,
Downloadable,
GeoTIFF,
Map Service,
Raster;
Tags: Arizona,
CRS,
California,
Climate,
Colorado,
Layers of geospatial data include contours, boundaries, land cover, hydrography, roads, transportation, geographic names, structures, and other selected map features.
Types: Citation;
Tags: 7.5 x 7.5 minute,
7.5 x 7.5 minute,
ClarkCounty,
Combined Vector,
Combined Vector,
This USGS Data Release supports USGS Scientific Investigations Report (SIR) 2017-5079. Following is the abstract from SIR 2017-5079: This report documents methodology and results of a study to evaluate groundwater discharge by evapotranspiration (GWET) in sparsely vegetated areas of Amargosa Desert and improve understanding of hydrologic-continuum processes controlling groundwater discharge. Evapotranspiration and GWET rates were computed and characterized at three sites over 2 years using a combination of micrometeorological, unsaturated zone, and stable-isotope measurements. One site (Amargosa Flat Shallow [AFS]) was in a sparse and isolated area of saltgrass (Distichlis spicata) where the depth to groundwater...
Categories: Data;
Types: Citation;
Tags: Amargosa Desert,
Amargosa Flat,
Evapotranspiration,
Groundwater levels,
Nevada,
Future climates are simulated by general circulation models (GCM) using climate change scenarios (IPCC 2014). To project climate change for the sagebrush biome, we used 11 GCMs and two climate change scenarios from the IPCC Fifth Assessment, representative concentration pathways (RCPs) 4.5 and 8.5 (Moss et al. 2010, Van Vuuren et al. 2011). RCP4.5 scenario represents a future where climate policies limit and achieve stabilization of greenhouse gas concentrations to 4.5 W m-2 by 2100. RCP8.5 scenario might be called a business-as-usual scenario, where high emissions of greenhouse gases continue in the absence of climate change policies. The two selected time frames allow comparison of near-term (2020-2050) and longer-term...
Categories: Data;
Types: Citation,
Downloadable,
GeoTIFF,
Map Service,
Raster;
Tags: Arizona,
CRS,
California,
Climate,
Colorado,
This dataset includes the magnetotelluric (MT) sounding data collected in 2005 along an east-west profile north of Wells, Nevada. It is important to know whether major mining districts in the Northern Nevada Gold Province are underlain by rocks of the Archean Wyoming craton, which are known to contain orogenic gold deposits, or by accreted rocks of the Paleoproterozoic Mojave province. It is also important to know the location and orientation of the Archean/Proterozoic suture zone between these provinces as well as major basement structures within these terranes because they may influence subsequent patterns of sedimentation, deformation, magmatism, and hydrothermal activity. This study was funded by the U.S. Geological...
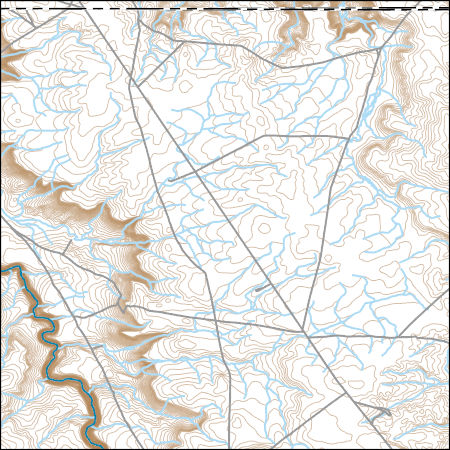
Layers of geospatial data include contours, boundaries, land cover, hydrography, roads, transportation, geographic names, structures, and other selected map features.
Types: Citation;
Tags: 7.5 x 7.5 minute,
7.5 x 7.5 minute,
Combined Vector,
Combined Vector,
Combined Vector,
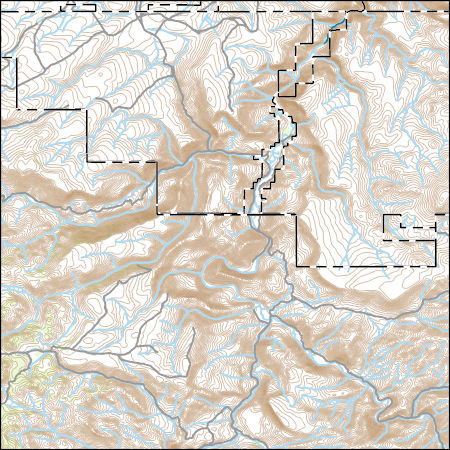
Layers of geospatial data include contours, boundaries, land cover, hydrography, roads, transportation, geographic names, structures, and other selected map features.
Types: Citation;
Tags: 7.5 x 7.5 minute,
7.5 x 7.5 minute,
Combined Vector,
Combined Vector,
Combined Vector,
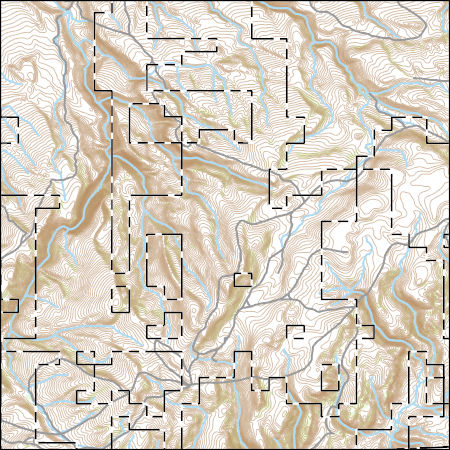
Layers of geospatial data include contours, boundaries, land cover, hydrography, roads, transportation, geographic names, structures, and other selected map features.
Types: Citation;
Tags: 7.5 x 7.5 minute,
7.5 x 7.5 minute,
Combined Vector,
Combined Vector,
Combined Vector,
|

|
