Filters: Tags: New York (X) > Types: Citation (X)
2,265 results (23ms)|
Filters
Date Range
Extensions
Types
Contacts
Categories Tag Types
|
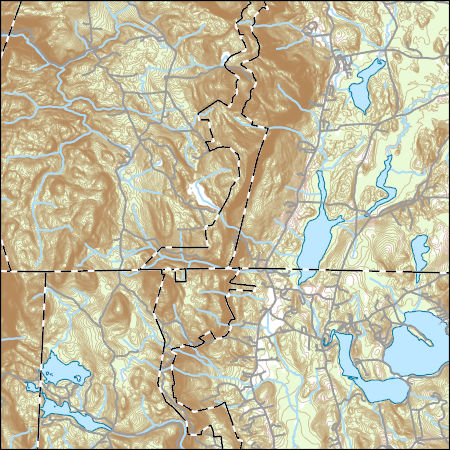
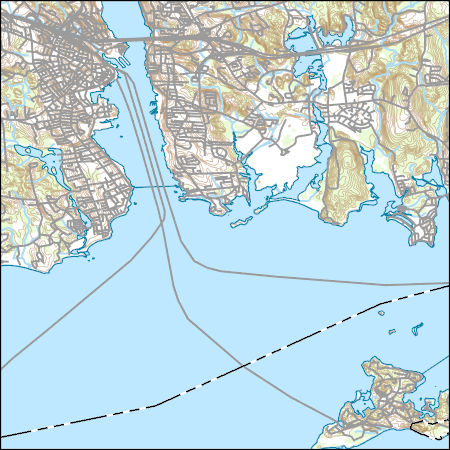
Layers of geospatial data include contours, boundaries, land cover, hydrography, roads, transportation, geographic names, structures, and other selected map features.
Types: Citation;
Tags: 7.5 x 7.5 minute,
7.5 x 7.5 minute,
BerkshireCounty,
ColumbiaCounty,
Combined Vector,
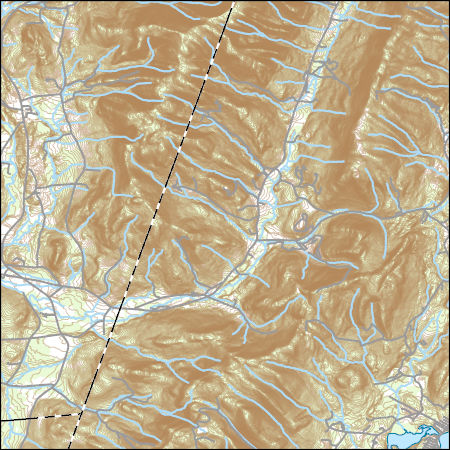
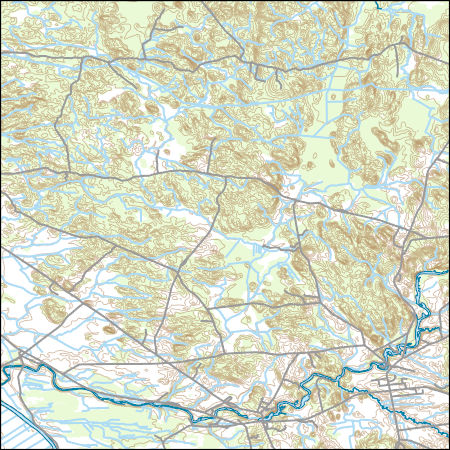
Layers of geospatial data include contours, boundaries, land cover, hydrography, roads, transportation, geographic names, structures, and other selected map features.
Types: Citation;
Tags: 7.5 x 7.5 minute,
7.5 x 7.5 minute,
BerkshireCounty,
ColumbiaCounty,
Combined Vector,
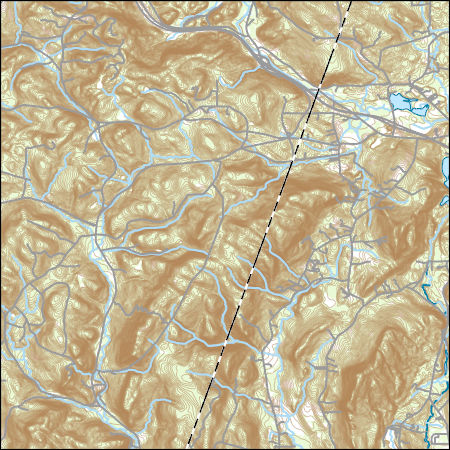
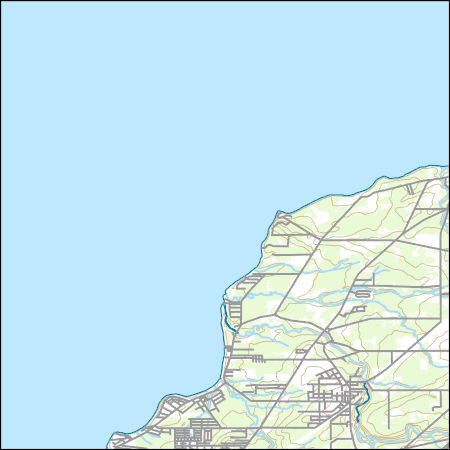
Layers of geospatial data include contours, boundaries, land cover, hydrography, roads, transportation, geographic names, structures, and other selected map features.
Types: Citation;
Tags: 7.5 x 7.5 minute,
7.5 x 7.5 minute,
BerkshireCounty,
ColumbiaCounty,
Combined Vector,
This dataset contains watershed means of estimated percent impervious surfaces for three time periods: 1992, 2002, and 2012. Estimates are based on coefficients derived from comparing land use of the 2012 NAWQA Wall-to-wall Anthropogenic Land-use Trends (NWALT) product to the 2011 National Land Cover Database (NLCD) imperviousness, then applying those coefficients to previous years (1974-2002) of the NWALT dataset.
Categories: Data;
Types: Citation;
Tags: Chesapeake Bay,
Delaware,
District of Columbia,
James River,
Maryland,
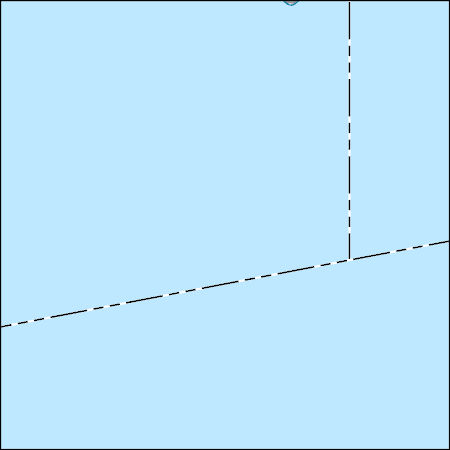
Layers of geospatial data include contours, boundaries, land cover, hydrography, roads, transportation, geographic names, structures, and other selected map features.
Surveys of the bathymetry and backscatter intensity of the sea floor south of Long Island, New York, were carried out in November 1998 using a Simrad EM1000 multibeam echosounder mounted on the Canadian Coast Guard ship Frederick G. Creed. The purpose of the multibeam echosounder surveys was to explore the bathymetry and backscatter intensity of the sea floor in several areas off the southern coast of Long Island along the 20-meter isobath. Survey areas offshore of Fire Island Inlet, Moriches Inlet, Shinnecock Inlet, and southwest of Montauk Point were about 1 kilometer (km) wide and 10 km long. The area was mapped by the U.S. Geological Survey with support from the Canadian Hydrographic Service and the University...
Layers of geospatial data include contours, boundaries, land cover, hydrography, roads, transportation, geographic names, structures, and other selected map features.
Types: Citation;
Tags: 7.5 x 7.5 minute,
7.5 x 7.5 minute,
Combined Vector,
Combined Vector,
Combined Vector,
The Health and Safety Laboratory (HASL) of the Atomic Energy Commission has provided much of the data on exposure assessment in uranium contractor facilities and on fallout radionuclides in the environment. The research performed in the beryllium industry 1947-1949 led to establishment of the protection standards that exist to this day. This laboratory was formed in 1947, as part of the Medical Division of the New York Operations Office, directed by B.S. Wolf. HASL was directed initially by Merril Eisenbud and subsequently by S. Allen Lough and John Harley. The history of the Laboratory is traced from its beginning, and the projects described that led to HASL's reputation as a trouble-shooting arm of the Atomic...
Categories: Publication;
Types: Citation;
Tags: Atomic Energy Commission,
Health,
Laboratory,
New York,
Office,
The Hudson Shelf Valley is the submerged seaward extension of the ancestral Hudson River drainage system and is the largest physiographic feature on the Middle Atlantic continental shelf. The valley begins offshore of New York and New Jersey at about 30-meter (m) water depth, runs southerly and then southeasterly across the Continental Shelf, and terminates on the outer shelf at about 85-m water depth landward of the head of the Hudson Canyon. Portions of the 150-kilometer-long valley were surveyed in 1996, 1998, and 2000 using a Simrad EM1000 multibeam echosounder mounted on the Canadian Coast Guard ship Frederick G. Creed. The purpose of the multibeam echosounder surveys was to map the bathymetry and backscatter...
The Sandy Hook artificial reef, located on the sea floor offshore of Sandy Hook, New Jersey was built to create habitat for marine life. The reef was created by the placement of heavy materials on the sea floor; ninety-five percent of the material in the Sandy Hook reef is rock. In 2000, the U.S. Geological Survey surveyed the area using a Simrad EM1000 multibeam echosounder mounted on the Canadian Coast Guard (CCG) ship Frederick G. Creed. The purpose of this multibeam survey, done in cooperation with the U.S. Army Corps of Engineers when the Creed was in the New York region in April 2000, was to map the bathymetry and backscatter intensity of the sea floor in the area of the Sandy Hook artificial reef. The collected...
Categories: Data;
Types: ArcGIS REST Map Service,
ArcGIS Service Definition,
Citation,
Downloadable,
Map Service;
Tags: GeoTIFF image,
Middle Atlantic Bight,
New Jersey,
New York,
New York Bight,
The Sandy Hook artificial reef, located on the sea floor offshore of Sandy Hook, New Jersey was built to create habitat for marine life. The reef was created by the placement of heavy materials on the sea floor; ninety-five percent of the material in the Sandy Hook reef is rock. In 2000, the U.S. Geological Survey surveyed the area using a Simrad EM1000 multibeam echosounder mounted on the Canadian Coast Guard (CCG) ship Frederick G. Creed. The purpose of this multibeam survey, done in cooperation with the U.S. Army Corps of Engineers when the Creed was in the New York region in April 2000, was to map the bathymetry and backscatter intensity of the sea floor in the area of the Sandy Hook artificial reef. The collected...
Categories: Data;
Types: Citation;
Tags: Middle Atlantic Bight,
New Jersey,
New York,
New York Bight,
North Atlantic Ocean,
The U. S. Geological Survey (USGS) makes long-term seismic hazard forecasts that are used in building codes. The hazard models usually consider only natural seismicity; non-tectonic (man-made) earthquakes are excluded because they are transitory or too small. In the past decade, however, thousands of earthquakes related to underground fluid injection have occurred in the central and eastern U.S. (CEUS), and some have caused damage. In response, the USGS is now also making short-term forecasts that account for the hazard from these induced earthquakes. A uniform earthquake catalog is assembled by combining and winnowing pre-existing source catalogs. Seismicity statistics are analyzed to develop recurrence models,...
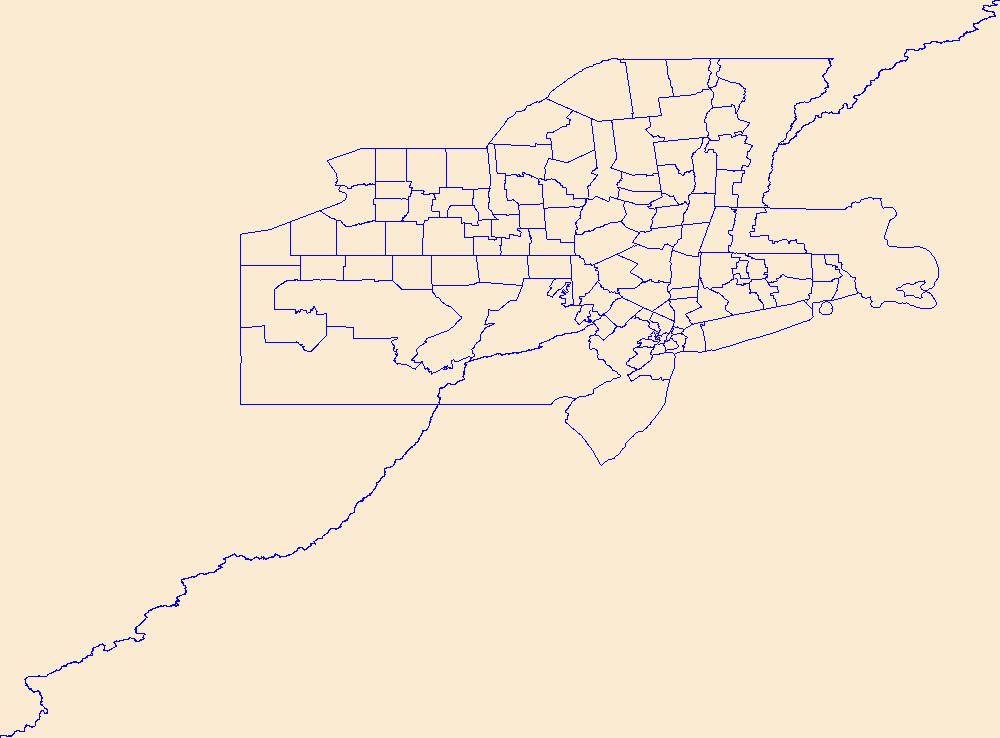
Geospatial data is comprised of government boundaries.
Layers of geospatial data include contours, boundaries, land cover, hydrography, roads, transportation, geographic names, structures, and other selected map features.
Types: Citation;
Tags: 7.5 x 7.5 minute,
7_5_Min,
Combined Vector,
Combined Vector,
Combined Vector,
Layers of geospatial data include contours, boundaries, land cover, hydrography, roads, transportation, geographic names, structures, and other selected map features.
Types: Citation;
Tags: 7.5 x 7.5 minute,
7_5_Min,
Combined Vector,
Combined Vector,
Combined Vector,
Layers of geospatial data include contours, boundaries, land cover, hydrography, roads, transportation, geographic names, structures, and other selected map features.
Types: Citation;
Tags: 7.5 x 7.5 minute,
7_5_Min,
Combined Vector,
Combined Vector,
Combined Vector,
Layers of geospatial data include contours, boundaries, land cover, hydrography, roads, transportation, geographic names, structures, and other selected map features.
Types: Citation;
Tags: 7.5 x 7.5 minute,
7_5_Min,
Combined Vector,
Combined Vector,
Combined Vector,
Layers of geospatial data include contours, boundaries, land cover, hydrography, roads, transportation, geographic names, structures, and other selected map features.
Types: Citation;
Tags: 7.5 x 7.5 minute,
7_5_Min,
Combined Vector,
Combined Vector,
Combined Vector,
Layers of geospatial data include contours, boundaries, land cover, hydrography, roads, transportation, geographic names, structures, and other selected map features.
Types: Citation;
Tags: 7.5 x 7.5 minute,
7_5_Min,
Combined Vector,
Combined Vector,
Combined Vector,
Layers of geospatial data include contours, boundaries, land cover, hydrography, roads, transportation, geographic names, structures, and other selected map features.
Types: Citation;
Tags: 7.5 x 7.5 minute,
7_5_Min,
Combined Vector,
Combined Vector,
Combined Vector,
|

|
