Filters: Tags: New York County (X)
16 results (121ms)|
Filters
Date Range
Extensions (Less) Types (Less)
Contacts (Less)
Categories (Less) Tag Types
|
Layered geospatial PDF 7.5 Minute Quadrangle Map. Layers of geospatial data include orthoimagery, roads, grids, geographic names, elevation contours, hydrography, and other selected map features. This map is derived from GIS (geospatial information system) data. It represents a repackaging of GIS data in traditional map form, not creation of new information. The geospatial data in this map are from selected National Map data holdings and other government sources.
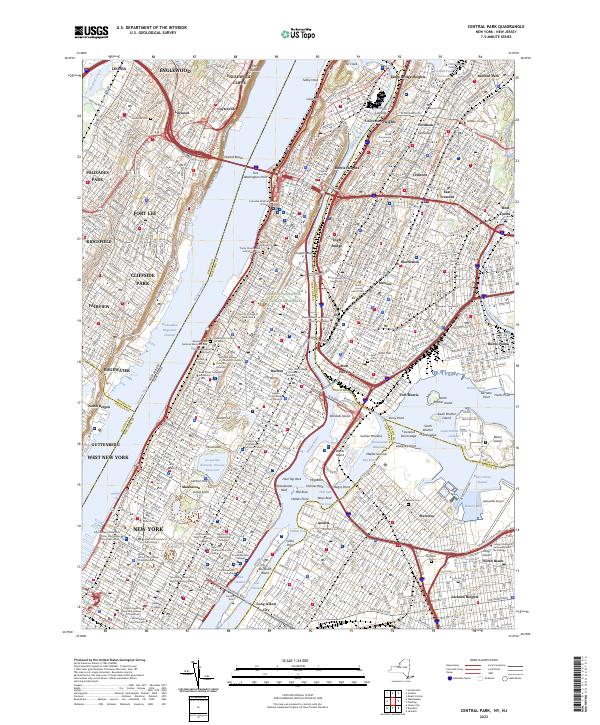
Layered geospatial PDF 7.5 Minute Quadrangle Map. Layers of geospatial data include orthoimagery, roads, grids, geographic names, elevation contours, hydrography, and other selected map features. This map is derived from GIS (geospatial information system) data. It represents a repackaging of GIS data in traditional map form, not creation of new information. The geospatial data in this map are from selected National Map data holdings and other government sources.
Layered geospatial PDF 7.5 Minute Quadrangle Map. Layers of geospatial data include orthoimagery, roads, grids, geographic names, elevation contours, hydrography, and other selected map features. This map is derived from GIS (geospatial information system) data. It represents a repackaging of GIS data in traditional map form, not creation of new information. The geospatial data in this map are from selected National Map data holdings and other government sources.
Layered geospatial PDF 7.5 Minute Quadrangle Map. Layers of geospatial data include orthoimagery, roads, grids, geographic names, elevation contours, hydrography, and other selected map features. This map is derived from GIS (geospatial information system) data. It represents a repackaging of GIS data in traditional map form, not creation of new information. The geospatial data in this map are from selected National Map data holdings and other government sources.
Layered geospatial PDF 7.5 Minute Quadrangle Map. Layers of geospatial data include orthoimagery, roads, grids, geographic names, elevation contours, hydrography, and other selected map features. This map is derived from GIS (geospatial information system) data. It represents a repackaging of GIS data in traditional map form, not creation of new information. The geospatial data in this map are from selected National Map data holdings and other government sources.
This data release contains data from five seismic-reflection surveys in New York’s East River between Governors Island and the Queensboro Bridge. Data are provided in the original proprietary data format, a SEGy data exchange format, and as a shape file of locations and depths to bedrock. Depths to bedrock were derived from the seismic signal travel time and an assumed speed of sound of 5,000 feet/second.
Categories: Data;
Types: Downloadable,
Map Service,
OGC WFS Layer,
OGC WMS Layer,
Shapefile;
Tags: Aquifer Mapping,
Bedrock,
East River,
Geophysics,
Kings County,
Using a combination of public and proprietary historical construction test borings, recent exploration drilling, USGS observation wells, outcrops, and seismic measurements, a series of geospatial overlays for bedrock elevation and overburden thickness were created for the Five Boroughs of New York City, New York. Rasters were interpolated from a point elevation data set and refined using published and interpretive bedrock contours, and interpreted glacial valleys and faults. Contours for bedrock elevation were generated at 100-ft contour intervals and smoothed. This data release includes shapefiles containing the input point elevation features and output contours, and rasters of interpolated bedrock elevation and...
Layered geospatial PDF 7.5 Minute Quadrangle Map. Layers of geospatial data include orthoimagery, roads, grids, geographic names, elevation contours, hydrography, and other selected map features. This map is derived from GIS (geospatial information system) data. It represents a repackaging of GIS data in traditional map form, not creation of new information. The geospatial data in this map are from selected National Map data holdings and other government sources.
Layered geospatial PDF 7.5 Minute Quadrangle Map. Layers of geospatial data include orthoimagery, roads, grids, geographic names, elevation contours, hydrography, and other selected map features. This map is derived from GIS (geospatial information system) data. It represents a repackaging of GIS data in traditional map form, not creation of new information. The geospatial data in this map are from selected National Map data holdings and other government sources.
Layered geospatial PDF 7.5 Minute Quadrangle Map. Layers of geospatial data include orthoimagery, roads, grids, geographic names, elevation contours, hydrography, and other selected map features. This map is derived from GIS (geospatial information system) data. It represents a repackaging of GIS data in traditional map form, not creation of new information. The geospatial data in this map are from selected National Map data holdings and other government sources.
This data set contains continuous water-surface elevation and water-quality (temperature, specific conductance, salinity, and turbidity) data recorded at 6- and 15-minute intervals, respectively, from two sites in the Bronx on the Harlem River -- Roberto Clemente State Park and Mill Pond Park. Water elevation was monitored every second to detect changes indicative of boat wakes expected to resuspend bed sediment from nearby alcoves. Boat wake detection triggered the collection of 1-second interval water elevation and 1-minute interval turbidity data. In addition to continuous data, grab samples for fecal indicator bacteria (Enterococci) and total suspended solids were collected weekly from - March to September,...
Categories: Data;
Types: Map Service,
OGC WFS Layer,
OGC WMS Layer,
OGC WMS Service;
Tags: Bronx County,
Contaminants, Microbial,
New York City,
New York County,
Surface-Water Quality Monitoring,
Layered geospatial PDF 7.5 Minute Quadrangle Map. Layers of geospatial data include orthoimagery, roads, grids, geographic names, elevation contours, hydrography, and other selected map features. This map is derived from GIS (geospatial information system) data. It represents a repackaging of GIS data in traditional map form, not creation of new information. The geospatial data in this map are from selected National Map data holdings and other government sources.
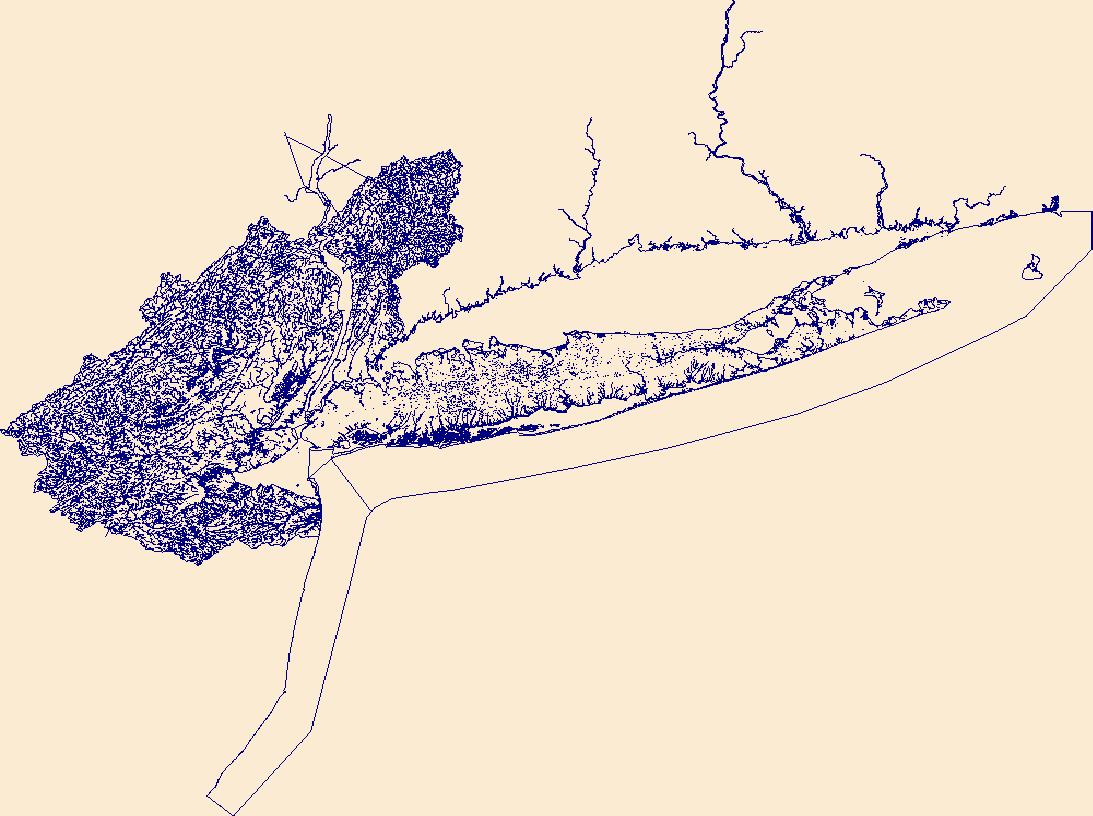
The High Resolution National Hydrography Dataset Plus (NHDPlus HR) is an integrated set of geospatial data layers, including the National Hydrography Dataset (NHD), National Watershed Boundary Dataset (WBD), and 3D Elevation Program Digital Elevation Model (3DEP DEM). The NHDPlus HR combines the NHD, 3DEP DEMs, and WBD to a data suite that includes the NHD stream network with linear referencing functionality, the WBD hydrologic units, elevation-derived catchment areas for each stream segment, "value added attributes" (VAAs), and other features that enhance hydrologic data analysis and routing.
Problem Previous hydrologic studies have indicated that there may be sufficient water resources underlying Richmond, New York, and Bronx Counties for use as a supplemental water supply by the New York City Department of Environmental Protection (NYCDEP) in times of a drought or other water shortage. Unfortunately, comprehensive data on the quantity and quality of the Counties' water resources are not available to make an accurate assessment. In order to evaluate the availability and suitability of these resources, representative and timely data on the ground-water and surface-water resources of these three Counties are needed. Objectives The primary objective is to develop, operate, and maintain long-term monitoring...
Categories: Data,
Project;
Types: Downloadable,
Map Service,
OGC WFS Layer,
OGC WMS Layer,
Shapefile;
Tags: Bronx County,
Completed,
Cooperative Water Program,
GW or SW,
GW or SW,
Layered geospatial PDF 7.5 Minute Quadrangle Map. Layers of geospatial data include orthoimagery, roads, grids, geographic names, elevation contours, hydrography, and other selected map features. This map is derived from GIS (geospatial information system) data. It represents a repackaging of GIS data in traditional map form, not creation of new information. The geospatial data in this map are from selected National Map data holdings and other government sources.
From March 2019 to September 2020, the U.S. Geological Survey, in cooperation with the New York City Department of Design and Construction and the New York State Department of Environmental Conservation, collected horizontal-to-vertical seismic (HVSR) surveys at 140 locations in New York, Bronx, Queens, Nassau, and Suffolk counties to estimate the thickness of unconsolidated sediments and the depth to bedrock (Lane and others, 2008). The passive-seismic method uses a single, broad-band three-component (two horizontal and one vertical) seismometer to record ambient seismic noise. In areas that have a strong acoustic contrast between the bedrock and overlying sediments, the seismic noise induces resonance at frequencies...
Categories: Data;
Types: Downloadable,
Map Service,
OGC WFS Layer,
OGC WMS Layer,
Shapefile;
Tags: Aquifer Mapping,
Basin & Hydrogeologic Characterization,
Bedrock,
Bronx County,
Nassau County,
|

|
