Filters: Tags: North Carolina (X)
8,672 results (43ms)|
Filters
Date Range
Extensions
Types
Contacts
Categories Tag Types
|
Sandy ocean beaches in the United States are popular tourist and recreational destinations and constitute some of the most valuable real estate in the country. The boundary between land and water along the coastline is often the location of concentrated residential and commercial development and is frequently exposed to a range of natural hazards, which include flooding, storm effects, and coastal erosion. In response, the U.S. Geological Survey (USGS) is conducting a national assessment of coastal change hazards. One component of this research effort, the National Assessment of Shoreline Change Project (http://coastal.er.usgs.gov/shoreline-change/), documents changes in shoreline position as a proxy for coastal...
Categories: Data;
Types: Citation,
Downloadable,
Map Service,
OGC WFS Layer,
OGC WMS Layer,
Shapefile;
Tags: Accretion,
Atlantic Coast,
CMGP,
Cape Hatteras,
Cape Lookout,
The U. S. Geological Survey (USGS) makes long-term seismic hazard forecasts that are used in building codes. The hazard models usually consider only natural seismicity; non-tectonic (man-made) earthquakes are excluded because they are transitory or too small. In the past decade, however, thousands of earthquakes related to underground fluid injection have occurred in the central and eastern U.S. (CEUS), and some have caused damage. In response, the USGS is now also making short-term forecasts that account for the hazard from these induced earthquakes. A uniform earthquake catalog is assembled by combining and winnowing pre-existing source catalogs. Seismicity statistics are analyzed to develop recurrence models,...
This shapefile contains landscape factors representing human disturbances summarized to local and network catchments of river reaches for the Desert Fish Habitat Partnership. This dataset is the result of clipping the feature class 'NFHAP 2010 HCI Scores and Human Disturbance Data for the Conterminous United States linked to NHDPLUSV1.gdb' to the boundary of the Desert Fish Habitat Partnership. Landscape factors include land uses, population density, roads, dams, mines, and point-source pollution sites. The source datasets that were compiled and attributed to catchments were identified as being: (1) meaningful for assessing fish habitat; (2) consistent across the entire study area in the way that they were assembled;...
Categories: Data;
Types: ArcGIS REST Map Service,
Downloadable,
Map Service,
OGC WFS Layer,
OGC WMS Layer,
Shapefile;
Tags: Anthropogenic factors,
Aquatic habitats,
Atlantic Coast FHP,
Catchment areas,
Connecticut,
The data document the results of several microbe bioassays performed by the USGS on Phragmites australis plants, including those performed on mature leaves, seedlings, and dead leaf tissues exploration of the literature to find accounts of microbes associated with Phragmites worldwide. For the bioassays, we prepared 162 pure cultures isolated from Phragmites plants in North America along the east coast, Florida, the Gulf of Mexico, and the Great Lakes area, 125 of which were from a previous study, and 38 represent new collections. The DNA sequences used to identify the 37 new collections are included. Microbes were isolated from plants collected from 2015-2018. We performed assays using both North American plant...
This shapefile is the official boundary of the Eastern Brook Trout Joint Venture. The boundary was originally developed by the United States Fish and Wildlife Service and was updated in 2013 to reflect revisions from the Eastern Brook Trout Joint Venture, a recognized Fish Habitat Partnership (FHP) of the National Fish Habitat Partnership.
Categories: Data;
Types: ArcGIS REST Map Service,
ArcGIS Service Definition,
Downloadable,
GeoTIFF,
Map Service,
Raster;
Tags: Analytical boundary,
Aquatic habitats,
Boundaries,
EBTJV,
FHP Boundary,
Understanding how sea-level rise will affect coastal landforms and the species and habitats they support is critical for crafting approaches that balance the needs of humans and native species. Given this increasing need to forecast sea-level rise effects on barrier islands in the near and long terms, we are developing Bayesian networks to evaluate and to forecast the cascading effects of sea-level rise on shoreline change, barrier island state, and piping plover habitat availability. We use publicly available data products, such as lidar, orthophotography, and geomorphic feature sets derived from those, to extract metrics of barrier island characteristics at consistent sampling distances. The metrics are then incorporated...
Categories: Data;
Types: Downloadable,
Map Service,
OGC WFS Layer,
OGC WMS Layer,
Shapefile;
Tags: Atlantic Ocean,
Barrier Island,
CMHRP,
Cape Lookout,
Cape Lookout,
Groundwater residence times were simulated for the major regional aquifers of the Northern Atlantic Coastal Plain aquifer system from New York to North Carolina using particle tracking in a regional groundwater flow model. Millions of particles were distributed throughout the aquifers of the North Atlantic Coastal Plain in a MODFLOW model with a volume-weighted algorithm, then tracked backwards using MODPATH6 (Pollock, 2012) until termination of their paths at their sources of origin, usually the simulated water table. Particles were tracked under simulated transient hydrologic conditions from the reference time of January 1, 2018 backwards to 1900, then under simulated steady-state conditions prior to 1900 until...
The dataset contains the analytical results for environmental and quality-control replicate sample sets and the computed relative percent differences (RPD) greater than 25 percent for the data collected during the surface-water sampling for the Triangle Area Water Supply Monitoring Project. The data are from samples collected during October 2015 through September 2017. Several study sites contained in this dataset were sampled for other USGS projects during the same time frame. Unless the samples at these sites were collected in conjunction with the Triangle Area Water Supply Monitoring Project, the data for other projects are not included in the dataset.

This map layer shows Indian lands of the United States. For the most part, only areas of 320 acres or more are included; some smaller areas deemed to be important or significant are also included. Federally-administered lands within a reservation are included for continuity; these may or may not be considered part of the reservation and are simply described with their feature type and the administrating Federal agency. Some established Indian lands which are larger than 320 acres are not included in this map layer because their boundaries were not available from the owning or administering agency.
The Critical Minerals in Archived Mine Samples Database (CMDB) contains chemistry and geologic information for historic ore and ore-related rock samples from mineral deposits in the United States. In addition, the database contains samples from archetypal deposits from 27 other countries in North America, South America, Asia, Africa and Europe. Samples were obtained from archived ore collections under the U.S. Geological Survey's project titled "Quick Assessment of Rare and Critical Metals in Ore Deposits: A National Assessment" (2008 to 2013) in an effort to begin an assessment of the Nations' previously mined ore deposits for critical minerals. Mineralized and altered rock samples were provided by the Colorado...
Categories: Data;
Types: ArcGIS REST Map Service,
ArcGIS Service Definition,
Downloadable,
Map Service,
OGC WFS Layer,
OGC WMS Layer,
Shapefile;
Tags: Alaska,
Argentina,
Arizona,
Arkansas,
Australia,
The U.S. Geological Survey (USGS) has developed and implemented an algorithm that identifies burned areas in dense time series of Landsat image stacks to produce the Landsat Burned Area Essential Climate Variable (BAECV) products. The algorithm makes use of predictors derived from individual Landsat scenes, lagged reference conditions, and change metrics between the scene and reference conditions. Outputs of the BAECV algorithm consist of pixel-level burn probabilities for each Landsat scene, and annual burn probability, burn classification, and burn date composites. These products were generated for the conterminous United States for 1984 through 2015. These data are also available for download at https://rmgsc.cr.usgs.gov/outgoing/baecv/BAECV_CONUS_v1.1_2017/...
The U.S. Geological Survey (USGS) has been engaged in airborne electromagnetics (AEM) since the 1970s, playing a role in the development of early acquisition systems, developing calibration methods, refining standards for data acquisition, improving data processing, modeling, and interpretation methods, and expanding the range of AEM applications. However, USGS AEM survey visibility and data accessibility has not advanced as rapidly as our use of the technique. This data release catalogs AEM surveys in the United States that have contributed to studies under USGS programs including Water, Geologic Mapping, Minerals, Energy, Environmental Health, Ecosystems, Hazards, and Climate. This dataset contains locations for...
Categories: Data;
Types: ArcGIS REST Map Service,
ArcGIS Service Definition,
Downloadable,
Map Service;
Tags: Alabama,
Arizona,
Arkansas,
California,
Colorado,
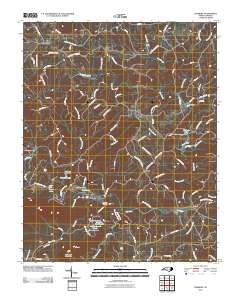
Layered GeoPDF 7.5 Minute Quadrangle Map. Layers of geospatial data include orthoimagery, roads, grids, geographic names, elevation contours, hydrography, and other selected map features.
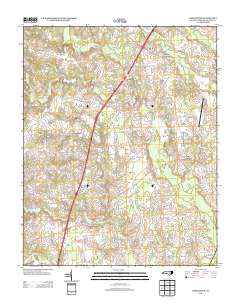
Layered GeoPDF 7.5 Minute Quadrangle Map. Layers of geospatial data include orthoimagery, roads, grids, geographic names, elevation contours, hydrography, and other selected map features.
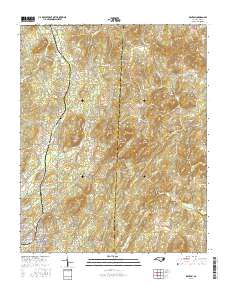
Layered geospatial PDF Map. Layers of geospatial data include orthoimagery, roads, grids, geographic names, elevation contours, hydrography, and other selected map features.
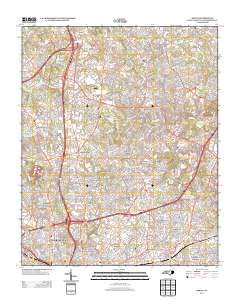
Layered GeoPDF 7.5 Minute Quadrangle Map. Layers of geospatial data include orthoimagery, roads, grids, geographic names, elevation contours, hydrography, and other selected map features.
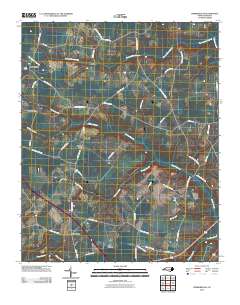
Layered GeoPDF 7.5 Minute Quadrangle Map. Layers of geospatial data include orthoimagery, roads, grids, geographic names, elevation contours, hydrography, and other selected map features.
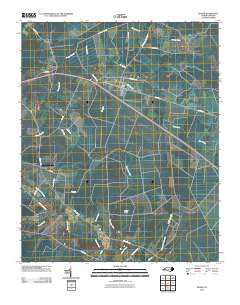
Layered GeoPDF 7.5 Minute Quadrangle Map. Layers of geospatial data include orthoimagery, roads, grids, geographic names, elevation contours, hydrography, and other selected map features.
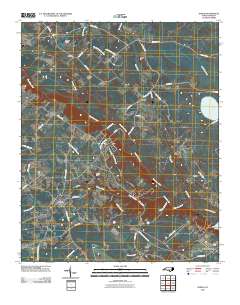
Layered GeoPDF 7.5 Minute Quadrangle Map. Layers of geospatial data include orthoimagery, roads, grids, geographic names, elevation contours, hydrography, and other selected map features.
|

|
