Filters: Tags: OCEAN CITY (X)
29 results (125ms)|
Filters
Date Range
Extensions Types Contacts
Categories Tag Types Tag Schemes |
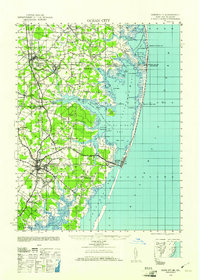
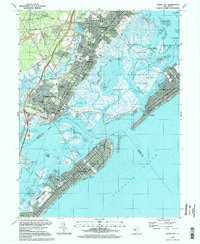
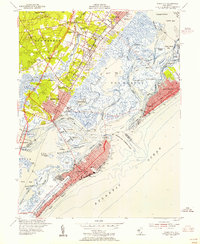
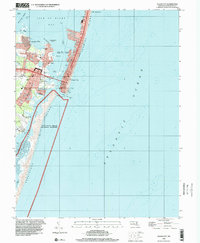
USGS Historical Quadrangle in GeoPDF.
This data set contains imagery from the National Agriculture Imagery Program (NAIP). The NAIP program is administered by USDA FSA and has been established to support two main FSA strategic goals centered on agricultural production. These are, increase stewardship of America's natural resources while enhancing the environment, and to ensure commodities are procured and distributed effectively and efficiently to increase food security. The NAIP program supports these goals by acquiring and providing ortho imagery that has been collected during the agricultural growing season in the U.S. The NAIP ortho imagery is tailored to meet FSA requirements and is a fundamental tool used to support FSA farm and conservation programs....
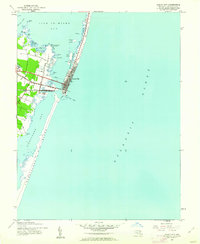
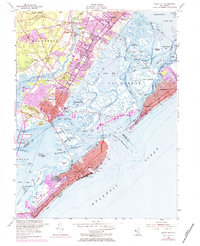
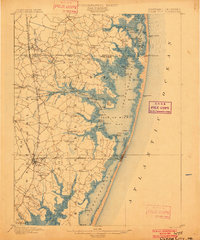
USGS Historical Quadrangle in GeoPDF.
These data are a qualitatively derived interpretive polygon shapefile defining surficial sediment type and distribution, and geomorphology, for nearly 1,400 square kilometers of sea floor on the inner-continental shelf from Fenwick Island, Maryland to Fisherman’s Island, Virginia, USA. These data are classified according to Barnhardt and others (1998) bottom-type classification system, which was modified to highlight changes in secondary sediment-types such as mud and gravel across this primarily sandy shelf. Most of the geophysical and sample data used to create this interpretive layer were collected as part of the Linking Coastal Processes and Vulnerability: Assateague Island Regional Study project (GS2-2C), supported...
Categories: Data;
Types: Downloadable,
Map Service,
OGC WFS Layer,
OGC WMS Layer,
Shapefile;
Tags: Assateague Island,
Assateague Island National Seashore,
Assawoman Island,
Atlantic Ocean,
Backscatter,
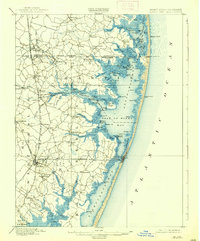
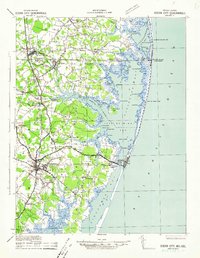
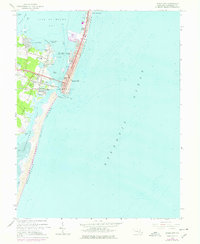
USGS Historical Quadrangle in GeoPDF.
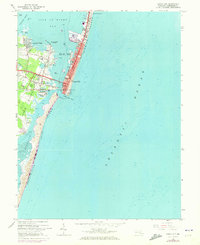
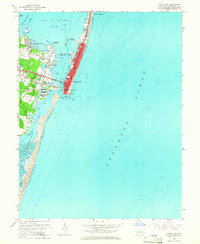
USGS Historical Quadrangle in GeoPDF.
The U.S. Geological Survey has been forecasting sea-level rise impacts on the landscape to evaluate where coastal land will be available for future use. The purpose of this project is to develop a spatially explicit, probabilistic model of coastal response for the Northeastern U.S. to a variety of sea-level scenarios that take into account the variable nature of the coast and provides outputs at spatial and temporal scales suitable for decision support. Model results provide predictions of adjusted land elevation ranges (AE) with respect to forecast sea-levels, a likelihood estimate of this outcome (PAE), and a probability of coastal response (CR) characterized as either static or dynamic. The predictions span the...
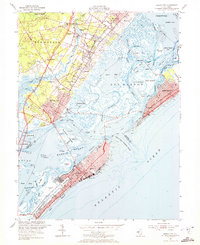
USGS Historical Quadrangle in GeoPDF.
USGS Historical Quadrangle in GeoPDF.
USGS Historical Quadrangle in GeoPDF.
USGS Historical Quadrangle in GeoPDF.
USGS Historical Quadrangle in GeoPDF.
USGS Historical Quadrangle in GeoPDF.
USGS Historical Quadrangle in GeoPDF.
USGS Historical Quadrangle in GeoPDF.
This data set contains imagery from the National Agriculture Imagery Program (NAIP). The NAIP program is administered by USDA FSA and has been established to support two main FSA strategic goals centered on agricultural production. These are, increase stewardship of America's natural resources while enhancing the environment, and to ensure commodities are procured and distributed effectively and efficiently to increase food security. The NAIP program supports these goals by acquiring and providing ortho imagery that has been collected during the agricultural growing season in the U.S. The NAIP ortho imagery is tailored to meet FSA requirements and is a fundamental tool used to support FSA farm and conservation programs....
The U.S. Geological Survey has been forecasting sea-level rise impacts on the landscape to evaluate where coastal land will be available for future use. The purpose of this project is to develop a spatially explicit, probabilistic model of coastal response for the Northeastern U.S. to a variety of sea-level scenarios that take into account the variable nature of the coast and provides outputs at spatial and temporal scales suitable for decision support. Model results provide predictions of adjusted land elevation ranges (AE) with respect to forecast sea-levels, a likelihood estimate of this outcome (PAE), and a probability of coastal response (CR) characterized as either static or dynamic. The predictions span the...
This data set contains imagery from the National Agriculture Imagery Program (NAIP). The NAIP program is administered by USDA FSA and has been established to support two main FSA strategic goals centered on agricultural production. These are, increase stewardship of America's natural resources while enhancing the environment, and to ensure commodities are procured and distributed effectively and efficiently to increase food security. The NAIP program supports these goals by acquiring and providing ortho imagery that has been collected during the agricultural growing season in the U.S. The NAIP ortho imagery is tailored to meet FSA requirements and is a fundamental tool used to support FSA farm and conservation programs....
USGS Historical Quadrangle in GeoPDF.
This data set contains imagery from the National Agriculture Imagery Program (NAIP). The NAIP program is administered by USDA FSA and has been established to support two main FSA strategic goals centered on agricultural production. These are, increase stewardship of America's natural resources while enhancing the environment, and to ensure commodities are procured and distributed effectively and efficiently to increase food security. The NAIP program supports these goals by acquiring and providing ortho imagery that has been collected during the agricultural growing season in the U.S. The NAIP ortho imagery is tailored to meet FSA requirements and is a fundamental tool used to support FSA farm and conservation programs....
|

|
