Filters: Tags: Ocean County (X) > Date Range: {"choice":"year"} (X)
66 results (56ms)|
Filters
Date Types (for Date Range)
Contacts
Categories Tag Types Tag Schemes |
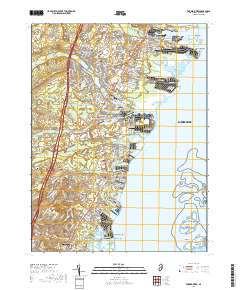
Layered geospatial PDF 7.5 Minute Quadrangle Map. Layers of geospatial data include orthoimagery, roads, grids, geographic names, elevation contours, hydrography, and other selected map features. This map is derived from GIS (geospatial information system) data. It represents a repackaging of GIS data in traditional map form, not creation of new information. The geospatial data in this map are from selected National Map data holdings and other government sources.
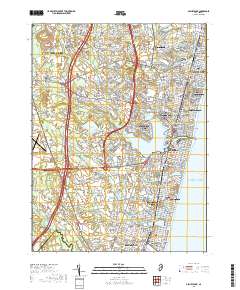
Layered geospatial PDF 7.5 Minute Quadrangle Map. Layers of geospatial data include orthoimagery, roads, grids, geographic names, elevation contours, hydrography, and other selected map features. This map is derived from GIS (geospatial information system) data. It represents a repackaging of GIS data in traditional map form, not creation of new information. The geospatial data in this map are from selected National Map data holdings and other government sources.
Digital flood-inundation maps for coastal communities within Ocean County in New Jersey were created by water surfaces generated by an Advanced Circulation hydrodynamic (ADCIRC) and Simulating Waves Nearshore (SWAN) model from the Federal Emergency Management Agency (FEMA) Region II coastal analysis and mapping study (Federal Emergency Management Agency, 2014). Six synthetic modeled tropical storm events from a library of 159 events were selected based on parameters including landfall location or closest approach location, maximum wind speed, central pressure, and radii of winds. Two storm events were selected for the tide gage providing two "scenarios" and accompanying inundation-map libraries. The contents of...
Digital flood-inundation maps for coastal communities within Ocean County in New Jersey were created by water surfaces generated by an Advanced Circulation hydrodynamic (ADCIRC) and Simulating Waves Nearshore (SWAN) model from the Federal Emergency Management Agency (FEMA) Region II coastal analysis and mapping study (Federal Emergency Management Agency, 2014). Six synthetic modeled tropical storm events from a library of 159 events were selected based on parameters including landfall location or closest approach location, maximum wind speed, central pressure, and radii of winds. Two storm events were selected for the tide gage providing two "scenarios" and accompanying inundation-map libraries. The contents of...
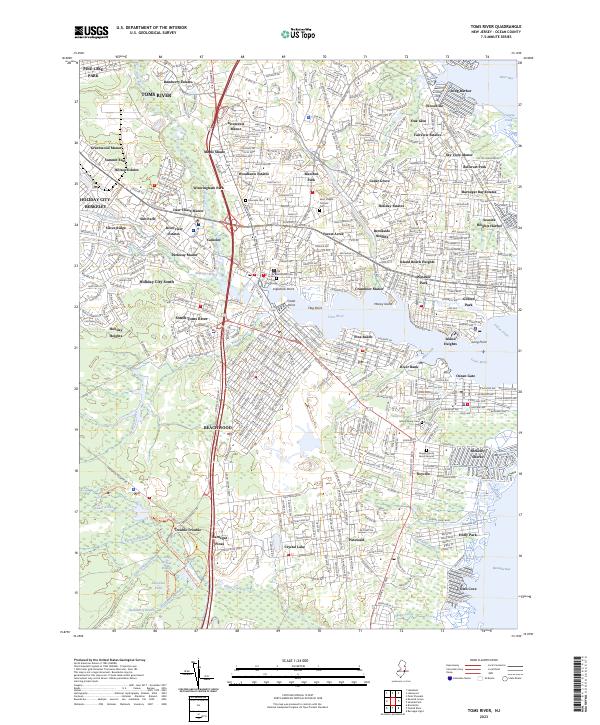
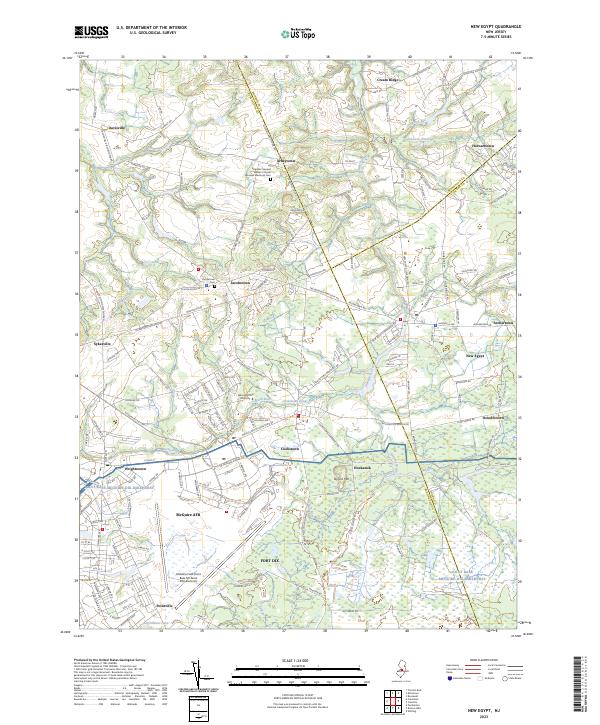
Layered geospatial PDF 7.5 Minute Quadrangle Map. Layers of geospatial data include orthoimagery, roads, grids, geographic names, elevation contours, hydrography, and other selected map features. This map is derived from GIS (geospatial information system) data. It represents a repackaging of GIS data in traditional map form, not creation of new information. The geospatial data in this map are from selected National Map data holdings and other government sources.
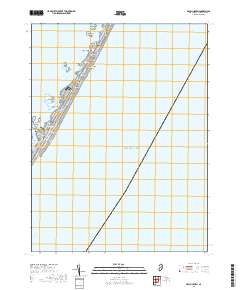
Layered geospatial PDF 7.5 Minute Quadrangle Map. Layers of geospatial data include orthoimagery, roads, grids, geographic names, elevation contours, hydrography, and other selected map features. This map is derived from GIS (geospatial information system) data. It represents a repackaging of GIS data in traditional map form, not creation of new information. The geospatial data in this map are from selected National Map data holdings and other government sources.
Layered geospatial PDF 7.5 Minute Quadrangle Map. Layers of geospatial data include orthoimagery, roads, grids, geographic names, elevation contours, hydrography, and other selected map features. This map is derived from GIS (geospatial information system) data. It represents a repackaging of GIS data in traditional map form, not creation of new information. The geospatial data in this map are from selected National Map data holdings and other government sources.
Layered geospatial PDF 7.5 Minute Quadrangle Map. Layers of geospatial data include orthoimagery, roads, grids, geographic names, elevation contours, hydrography, and other selected map features. This map is derived from GIS (geospatial information system) data. It represents a repackaging of GIS data in traditional map form, not creation of new information. The geospatial data in this map are from selected National Map data holdings and other government sources.
Layered geospatial PDF 7.5 Minute Quadrangle Map. Layers of geospatial data include orthoimagery, roads, grids, geographic names, elevation contours, hydrography, and other selected map features. This map is derived from GIS (geospatial information system) data. It represents a repackaging of GIS data in traditional map form, not creation of new information. The geospatial data in this map are from selected National Map data holdings and other government sources.

A three-dimensional groundwater flow model was developed to simulate the effects of withdrawals on the groundwater-flow systems of five aquifers in and around Ocean County, New Jersey—the unconfined Kirkwood-Cohansey aquifer system and Vincentown aquifer, and three confined aquifers--the Rio Grande water-bearing zone, the Atlantic City 800-foot sand, and the Piney Point aquifer. A transient model was used to simulate conditions that represent no groundwater withdrawals, 2000–2003 groundwater withdrawals, and maximum-allocation groundwater withdrawals. Particle-tracking analysis, using results from two steady-state simulations, determine flow paths and travel times to near-shore wells screened in the unconfined Kirkwood-Cohansey...
Layered geospatial PDF 7.5 Minute Quadrangle Map. Layers of geospatial data include orthoimagery, roads, grids, geographic names, elevation contours, hydrography, and other selected map features. This map is derived from GIS (geospatial information system) data. It represents a repackaging of GIS data in traditional map form, not creation of new information. The geospatial data in this map are from selected National Map data holdings and other government sources.
Layered geospatial PDF 7.5 Minute Quadrangle Map. Layers of geospatial data include orthoimagery, roads, grids, geographic names, elevation contours, hydrography, and other selected map features. This map is derived from GIS (geospatial information system) data. It represents a repackaging of GIS data in traditional map form, not creation of new information. The geospatial data in this map are from selected National Map data holdings and other government sources.
Digital flood-inundation maps for an approximately 295-mile length of the New Jersey coastline and tidewaters through 10-coastal counties stretching from Cumberland County through Bergen County; including Cumberland, Cape May, Atlantic, Ocean, Monmouth, Middlesex, Union, Essex, Hudson, and Bergen counties were created by the U.S Geological Survey (USGS) in cooperation with the New Jersey Department of Environmental Protection (NJDEP) and New Jersey Office of Emergency Management (NJOEM). The flood-inundation maps depict extent and depth estimates of coastal flooding corresponding to selected tidal elevations recorded by 25 real-time USGS tide gages located throughout the length of the study area coastline. The flood-inundation...
Categories: Data;
Types: Map Service,
OGC WFS Layer,
OGC WMS Layer,
OGC WMS Service;
Tags: Atlantic County,
Bergen County,
Cape May County,
Cumberland County,
Essex County,
Layered geospatial PDF 7.5 Minute Quadrangle Map. Layers of geospatial data include orthoimagery, roads, grids, geographic names, elevation contours, hydrography, and other selected map features. This map is derived from GIS (geospatial information system) data. It represents a repackaging of GIS data in traditional map form, not creation of new information. The geospatial data in this map are from selected National Map data holdings and other government sources.
Layered geospatial PDF 7.5 Minute Quadrangle Map. Layers of geospatial data include orthoimagery, roads, grids, geographic names, elevation contours, hydrography, and other selected map features. This map is derived from GIS (geospatial information system) data. It represents a repackaging of GIS data in traditional map form, not creation of new information. The geospatial data in this map are from selected National Map data holdings and other government sources.
Layered geospatial PDF 7.5 Minute Quadrangle Map. Layers of geospatial data include orthoimagery, roads, grids, geographic names, elevation contours, hydrography, and other selected map features. This map is derived from GIS (geospatial information system) data. It represents a repackaging of GIS data in traditional map form, not creation of new information. The geospatial data in this map are from selected National Map data holdings and other government sources.
Layered geospatial PDF 7.5 Minute Quadrangle Map. Layers of geospatial data include orthoimagery, roads, grids, geographic names, elevation contours, hydrography, and other selected map features. This map is derived from GIS (geospatial information system) data. It represents a repackaging of GIS data in traditional map form, not creation of new information. The geospatial data in this map are from selected National Map data holdings and other government sources.
Layered geospatial PDF 7.5 Minute Quadrangle Map. Layers of geospatial data include orthoimagery, roads, grids, geographic names, elevation contours, hydrography, and other selected map features. This map is derived from GIS (geospatial information system) data. It represents a repackaging of GIS data in traditional map form, not creation of new information. The geospatial data in this map are from selected National Map data holdings and other government sources.
Layered geospatial PDF 7.5 Minute Quadrangle Map. Layers of geospatial data include orthoimagery, roads, grids, geographic names, elevation contours, hydrography, and other selected map features. This map is derived from GIS (geospatial information system) data. It represents a repackaging of GIS data in traditional map form, not creation of new information. The geospatial data in this map are from selected National Map data holdings and other government sources.
Digital flood-inundation maps for coastal communities within Ocean County in New Jersey were created by water surfaces generated by an Advanced Circulation hydrodynamic (ADCIRC) and Simulating Waves Nearshore (SWAN) model from the Federal Emergency Management Agency (FEMA) Region II coastal analysis and mapping study (Federal Emergency Management Agency, 2014). Six synthetic modeled tropical storm events from a library of 159 events were selected based on parameters including landfall location or closest approach location, maximum wind speed, central pressure, and radii of winds. Two storm events were selected for the tide gage providing two "scenarios" and accompanying inundation-map libraries. The contents of...
|

|
