Filters: Tags: Ocean County (X)
73 results (58ms)|
Filters
Date Range
Extensions Types Contacts
Categories Tag Types Tag Schemes |
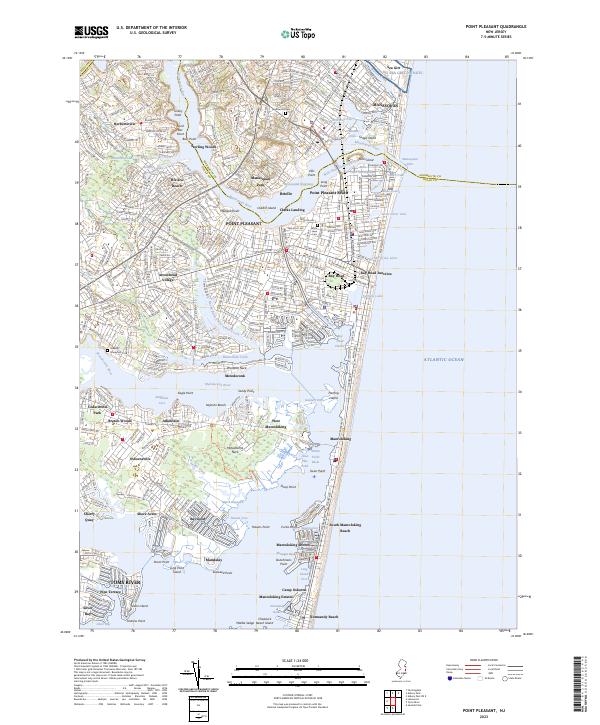
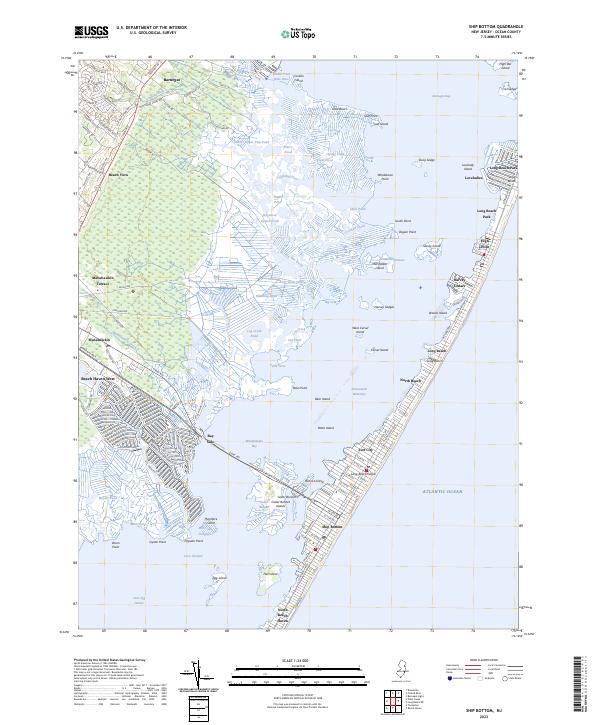
Layered geospatial PDF 7.5 Minute Quadrangle Map. Layers of geospatial data include orthoimagery, roads, grids, geographic names, elevation contours, hydrography, and other selected map features. This map is derived from GIS (geospatial information system) data. It represents a repackaging of GIS data in traditional map form, not creation of new information. The geospatial data in this map are from selected National Map data holdings and other government sources.
Layered geospatial PDF 7.5 Minute Quadrangle Map. Layers of geospatial data include orthoimagery, roads, grids, geographic names, elevation contours, hydrography, and other selected map features. This map is derived from GIS (geospatial information system) data. It represents a repackaging of GIS data in traditional map form, not creation of new information. The geospatial data in this map are from selected National Map data holdings and other government sources.
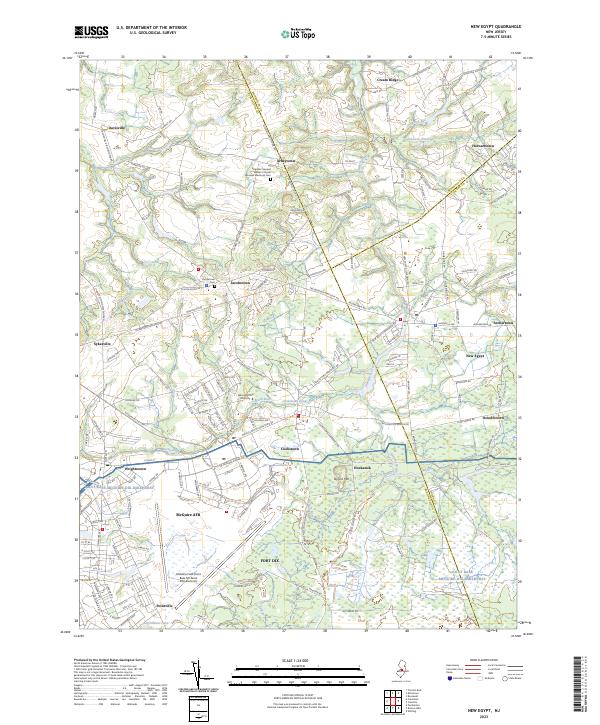
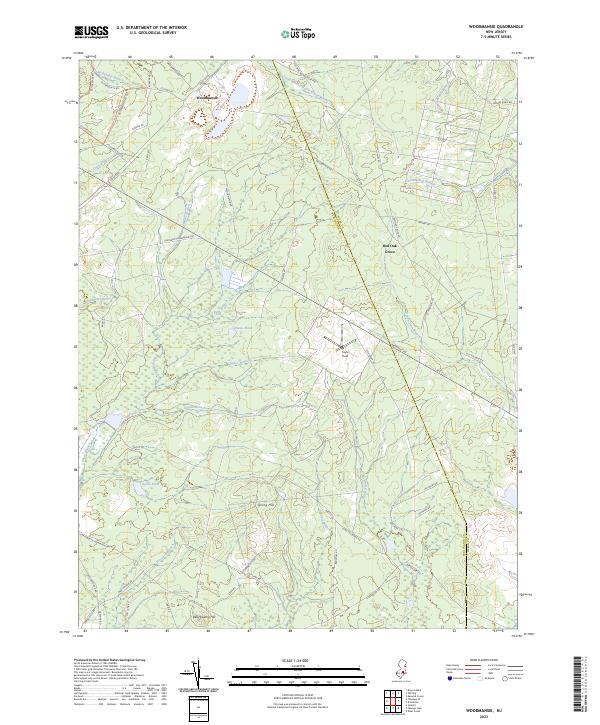
Layered geospatial PDF 7.5 Minute Quadrangle Map. Layers of geospatial data include orthoimagery, roads, grids, geographic names, elevation contours, hydrography, and other selected map features. This map is derived from GIS (geospatial information system) data. It represents a repackaging of GIS data in traditional map form, not creation of new information. The geospatial data in this map are from selected National Map data holdings and other government sources.
Digital flood-inundation maps for coastal communities within Ocean County in New Jersey were created by water surfaces generated by an Advanced Circulation hydrodynamic (ADCIRC) and Simulating Waves Nearshore (SWAN) model from the Federal Emergency Management Agency (FEMA) Region II coastal analysis and mapping study (Federal Emergency Management Agency, 2014). Six synthetic modeled tropical storm events from a library of 159 events were selected based on parameters including landfall location or closest approach location, maximum wind speed, central pressure, and radii of winds. Two storm events were selected for the tide gage providing two "scenarios" and accompanying inundation-map libraries. The contents of...
The change detection data is the classified difference in the percentage of vegetation on the July 14, 2011 Landsat Thematic Mapper(TM) data set collected before Hurricane Sandy and the July 19, 2013 Landsat Operational Land Imager (OLI)data set collected after Hurricane Sandy. Hurricane Sandy made landfall near Brigandine, New Jersey on October 29, 2012. The actual difference in the percentage of vegetation is used in the calculation, not the three-class classification that is the basis of the Marsh Surface Condition Index data. The eleven classes consist of five classes (5-20%,>20%-40%,>40%-60%,>60%-80%,>80%)with decreases in the percentage of vegetation cover after Hurricane Sandy, Three classes (5-20%,>20%-40%,>40%-60%)with...
Categories: Data;
Types: Citation,
Downloadable,
GeoTIFF,
Map Service,
Raster;
Tags: Atlantic County,
Barnegat Bay,
Cape May County,
Coastal Zone,
Environmental restoration,
Digital flood-inundation maps for coastal communities within Ocean County in New Jersey were created by water surfaces generated by an Advanced Circulation hydrodynamic (ADCIRC) and Simulating Waves Nearshore (SWAN) model from the Federal Emergency Management Agency (FEMA) Region II coastal analysis and mapping study (Federal Emergency Management Agency, 2014). Six synthetic modeled tropical storm events from a library of 159 events were selected based on parameters including landfall location or closest approach location, maximum wind speed, central pressure, and radii of winds. Two storm events were selected for the tide gage providing two "scenarios" and accompanying inundation-map libraries. The contents of...
A three-dimensional groundwater flow model using MODFLOW 6 (version 6.2.2) was developed and calibrated for unconsolidated Coastal Plain aquifers underlying the Joint Base McGuire-Dix-Lakehurst (JBMDL) and vicinity, New Jersey, to evaluate groundwater flow pathways of per- and polyfluoroalkyl substances (PFAS) contamination associated with use of aqueous film forming foam (AFFF). The model was developed and calibrated by the U.S. Geological Survey (USGS) in cooperation with the U.S. Air Force Civil Engineer Center (AFCEC) based on the previously developed hydrogeologic framework (https://doi.org/10.3133/ofr20191134). Steady-state flow in the unconsolidated aquifers was simulated using the MODFLOW 6 which accounts...
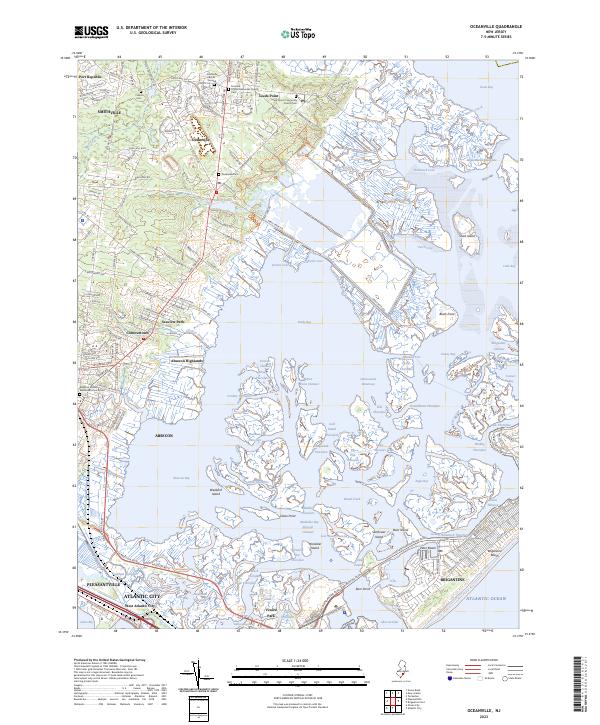
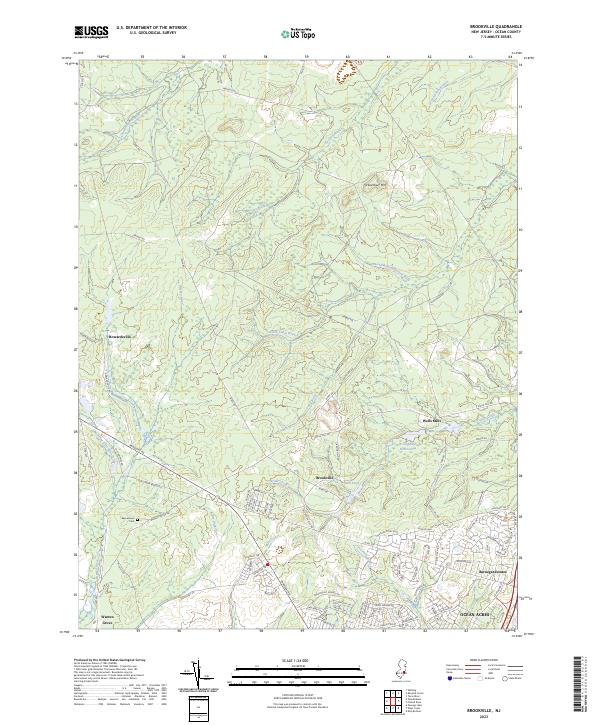
Layered geospatial PDF 7.5 Minute Quadrangle Map. Layers of geospatial data include orthoimagery, roads, grids, geographic names, elevation contours, hydrography, and other selected map features. This map is derived from GIS (geospatial information system) data. It represents a repackaging of GIS data in traditional map form, not creation of new information. The geospatial data in this map are from selected National Map data holdings and other government sources.
Layered geospatial PDF 7.5 Minute Quadrangle Map. Layers of geospatial data include orthoimagery, roads, grids, geographic names, elevation contours, hydrography, and other selected map features. This map is derived from GIS (geospatial information system) data. It represents a repackaging of GIS data in traditional map form, not creation of new information. The geospatial data in this map are from selected National Map data holdings and other government sources.
A third revision of the New Jersey Coastal Plain (NJCP) groundwater flow model, using MODFLOW-2005 (version 1.12.00), was completed to maintain the model’s usefulness for water-resource managment and development. The regional groundwater-flow model was initially developed for the U.S. Geological Survey (USGS) Regional Aquifer System Analysis (RASA) program. Periodic revision of the model is required as the result of changing hydrologic stresses, different and more complex water management needs, and increased knowledge of hydrologic conditions. The RASA model was initially constructed in the 1980’s as a quasi-3D model with 10 aquifers. The 9 intervening confining units were simulated using vertical leakage parameters...
Layered geospatial PDF 7.5 Minute Quadrangle Map. Layers of geospatial data include orthoimagery, roads, grids, geographic names, elevation contours, hydrography, and other selected map features. This map is derived from GIS (geospatial information system) data. It represents a repackaging of GIS data in traditional map form, not creation of new information. The geospatial data in this map are from selected National Map data holdings and other government sources.
Layered geospatial PDF 7.5 Minute Quadrangle Map. Layers of geospatial data include orthoimagery, roads, grids, geographic names, elevation contours, hydrography, and other selected map features. This map is derived from GIS (geospatial information system) data. It represents a repackaging of GIS data in traditional map form, not creation of new information. The geospatial data in this map are from selected National Map data holdings and other government sources.
Layered geospatial PDF 7.5 Minute Quadrangle Map. Layers of geospatial data include orthoimagery, roads, grids, geographic names, elevation contours, hydrography, and other selected map features. This map is derived from GIS (geospatial information system) data. It represents a repackaging of GIS data in traditional map form, not creation of new information. The geospatial data in this map are from selected National Map data holdings and other government sources.
Layered geospatial PDF 7.5 Minute Quadrangle Map. Layers of geospatial data include orthoimagery, roads, grids, geographic names, elevation contours, hydrography, and other selected map features. This map is derived from GIS (geospatial information system) data. It represents a repackaging of GIS data in traditional map form, not creation of new information. The geospatial data in this map are from selected National Map data holdings and other government sources.

Layered geospatial PDF 7.5 Minute Quadrangle Map. Layers of geospatial data include orthoimagery, roads, grids, geographic names, elevation contours, hydrography, and other selected map features. This map is derived from GIS (geospatial information system) data. It represents a repackaging of GIS data in traditional map form, not creation of new information. The geospatial data in this map are from selected National Map data holdings and other government sources.
Layered geospatial PDF 7.5 Minute Quadrangle Map. Layers of geospatial data include orthoimagery, roads, grids, geographic names, elevation contours, hydrography, and other selected map features. This map is derived from GIS (geospatial information system) data. It represents a repackaging of GIS data in traditional map form, not creation of new information. The geospatial data in this map are from selected National Map data holdings and other government sources.
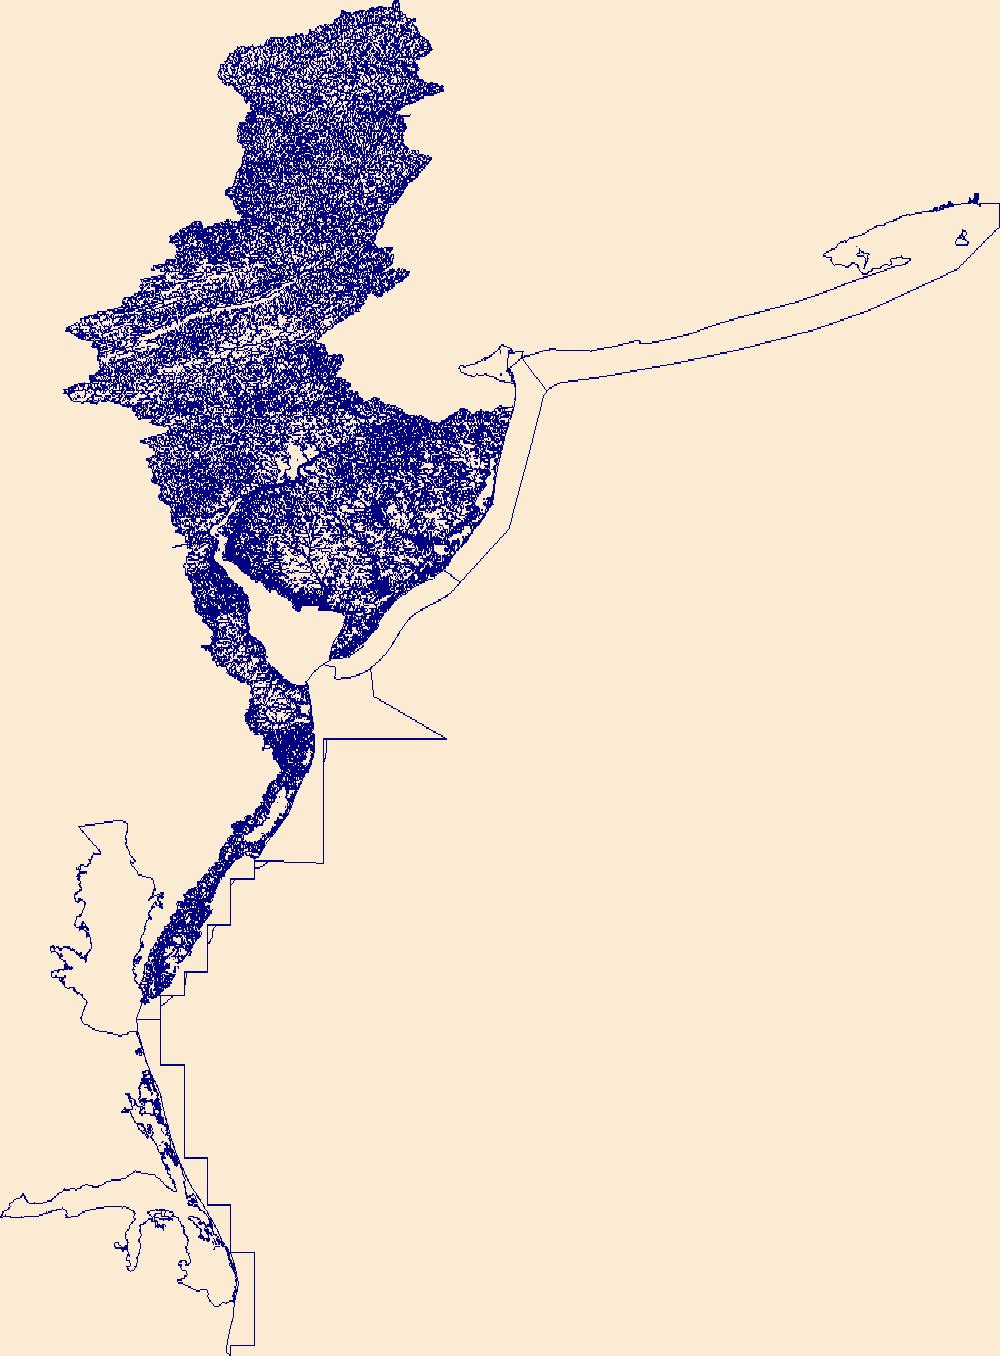
The High Resolution National Hydrography Dataset Plus (NHDPlus HR) is an integrated set of geospatial data layers, including the National Hydrography Dataset (NHD), National Watershed Boundary Dataset (WBD), and 3D Elevation Program Digital Elevation Model (3DEP DEM). The NHDPlus HR combines the NHD, 3DEP DEMs, and WBD to a data suite that includes the NHD stream network with linear referencing functionality, the WBD hydrologic units, elevation-derived catchment areas for each stream segment, "value added attributes" (VAAs), and other features that enhance hydrologic data analysis and routing.

A groundwater-flow model that was previously developed by the U. S. Geological Survey of Ocean County, N.J. (https://doi.org/10.3133/sir20165035) was used in an analysis of groundwater flow in the Kirkwood-Cohansey aquifer system and deeper confined aquifers that underlie the Barnegat Bay-Little Egg Harbor (BB-LEH) watershed and estuary. The analysis used a MODFLOW2005 simulation, in conjunction with the particle-tracking computer program MODPATH (Pollock, 1994), to delineate particle flow paths, the discharge location of each particle, and estimate the travel time along flow paths to the BB LEH estuary and streams within the BB-LEH watershed. This study conducted by the USGS, in cooperation with the Barnegat Bay...
Layered geospatial PDF 7.5 Minute Quadrangle Map. Layers of geospatial data include orthoimagery, roads, grids, geographic names, elevation contours, hydrography, and other selected map features. This map is derived from GIS (geospatial information system) data. It represents a repackaging of GIS data in traditional map form, not creation of new information. The geospatial data in this map are from selected National Map data holdings and other government sources.
Layered geospatial PDF 7.5 Minute Quadrangle Map. Layers of geospatial data include orthoimagery, roads, grids, geographic names, elevation contours, hydrography, and other selected map features. This map is derived from GIS (geospatial information system) data. It represents a repackaging of GIS data in traditional map form, not creation of new information. The geospatial data in this map are from selected National Map data holdings and other government sources.
|

|
