Filters: Tags: PNW (X)
148 results (24ms)|
Filters
Date Range
Extensions Types
Contacts
Categories Tag Types
|
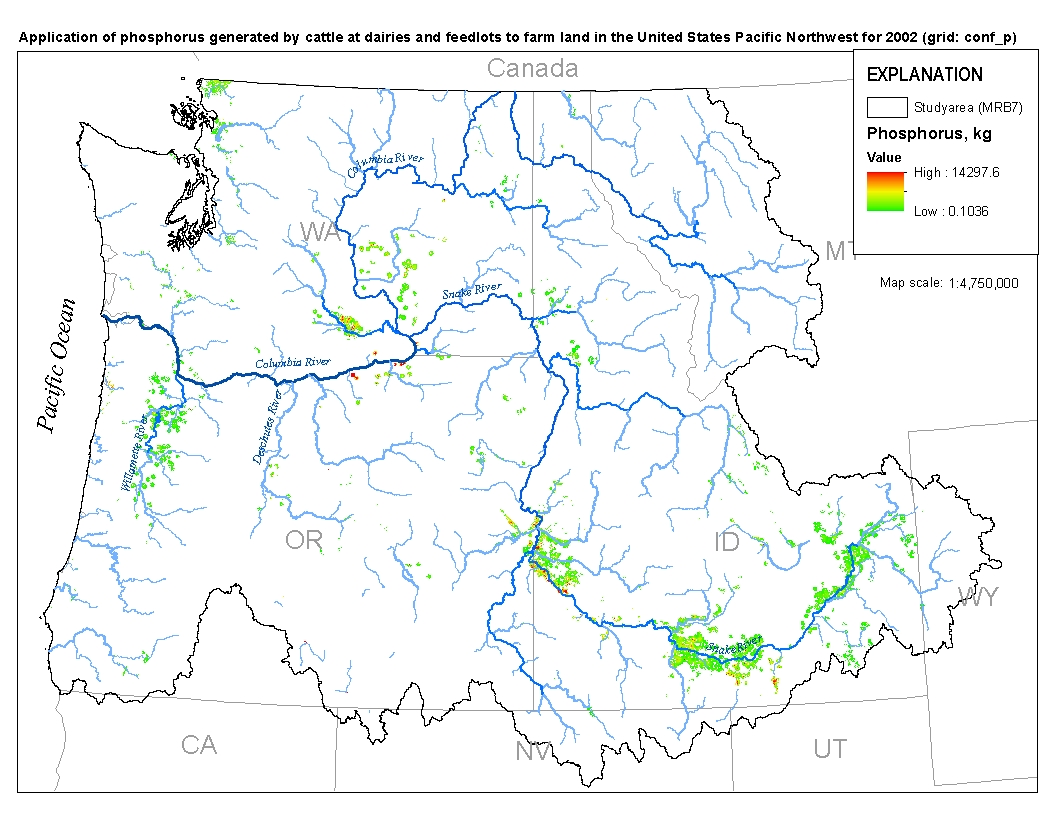
This spatial data set was created by the U.S. Geological Survey (USGS) to represent the amount of phosphorus generated at confined cattle operations that was applied to nearby farm land in the Pacific Northwest region of the United States (Hydro Region 17; Major River Basin 7 (MRB7)) during 2002.

These data were released prior to the October 1, 2016 effective date for the USGS’s policy dictating the review, approval, and release of scientific data as referenced in USGS Survey Manual Chapter 502.8 Fundamental Science Practices: Review and Approval of Scientific Data for Release. This spatial data set was created by the U.S. Geological Survey (USGS) to represent the extent of soils with high phosphorus retention potential in the Pacific Northwest region of the United States (Hydro Region 17; Major River Basin 7 (MRB7)).

These data were released prior to the October 1, 2016 effective date for the USGS’s policy dictating the review, approval, and release of scientific data as referenced in USGS Survey Manual Chapter 502.8 Fundamental Science Practices: Review and Approval of Scientific Data for Release. This spatial data set was created by the U.S. Geological Survey (USGS) to represent the amount of nitrogen generated by pastured, non-cattle livestock that was applied to pasture land in the Pacific Northwest region of the United States (Hydro Region 17; Major River Basin 7 (MRB7)) during 2002.

These data were released prior to the October 1, 2016 effective date for the USGS’s policy dictating the review, approval, and release of scientific data as referenced in USGS Survey Manual Chapter 502.8 Fundamental Science Practices: Review and Approval of Scientific Data for Release. This spatial data set was created by the U.S. Geological Survey (USGS) to represent the extent of arid land irrigation in the Pacific Northwest region of the United States (Hydro Region 17; Major River Basin 7 (MRB7)) during 2001.

These data were released prior to the October 1, 2016 effective date for the USGS’s policy dictating the review, approval, and release of scientific data as referenced in USGS Survey Manual Chapter 502.8 Fundamental Science Practices: Review and Approval of Scientific Data for Release. This spatial data set was created by the U.S. Geological Survey (USGS) to represent the extent of land in the Pacific Northwest region of the United States (Hydro Region 17; Major River Basin 7 (MRB7)) that potentially received waste from grazing cattle in 2002.

For his MS thesis, Brendan Rogers used the vegetation model MC1 to simulate vegetation dynamics, associated carbon and nitrogen cycle, water budget and wild fire impacts across the western 2/3 of the states of Oregon and Washington using climate input data from the PRISM group (Chris Daly, OSU) at a 30arc second (800m) spatial grain. The model was run from 1895 to 2100 assuming that nitrogen demand from the plants was always met so that the nitrogen concentrations in various plant parts never dropped below their minimum reported values. A CO2 enhancement effect increased productivity and water use efficiency as the atmospheric CO2 concentration increased. Future climate change scenarios were generated through statistical...

For his MS thesis, Brendan Rogers used the vegetation model MC1 to simulate vegetation dynamics, associated carbon and nitrogen cycle, water budget and wild fire impacts across the western 2/3 of the states of Oregon and Washington using climate input data from the PRISM group (Chris Daly, OSU) at a 30arc second (800m) spatial grain. The model was run from 1895 to 2100 assuming that nitrogen demand from the plants was always met so that the nitrogen concentrations in various plant parts never dropped below their minimum reported values. A CO2 enhancement effect increased productivity and water use efficiency as the atmospheric CO2 concentration increased. Future climate change scenarios were generated through statistical...

Gridded data show total mean carbon content in vegetation for 1961-1990 and originate from outputs of the MC1 dynamic vegetation model (Bachelet et al., 2001a, Bachelet et al., 2001b) in an 8.8 km2 grid cell resolution. Data were transformed to a standardized scale based on their maximum values. Hence, all values range between 0 and 1.

For his MS thesis, Brendan Rogers used climate data from the PRISM group (Chris Daly, Oregon State University) at a 30arc second (800m) spatial grain across the western 2/3 of the states of Oregon and Washington (USA) to generate a climatology or baseline. He then created future climate change scenarios using statistical downscaling to create anomalies from three General Circulation Models (CSIRO Mk3, MIROC 3.2 medres, and Hadley CM 3), each run through three CO2 emission scenarios (SRES B1, A1B, and A2).

For his MS thesis, Brendan Rogers used climate data from the PRISM group (Chris Daly, Oregon State University) at a 30arc second (800m) spatial grain across the western 2/3 of the states of Oregon and Washington (USA) to generate a climatology or baseline. He then created future climate change scenarios using statistical downscaling to create anomalies from three General Circulation Models (CSIRO Mk3, MIROC 3.2 medres, and Hadley CM 3), each run through three CO2 emission scenarios (SRES B1, A1B, and A2).

For his MS thesis, Brendan Rogers used climate data from the PRISM group (Chris Daly, Oregon State University) at a 30arc second (800m) spatial grain across the western 2/3 of the states of Oregon and Washington to generate a climatology or baseline. He then created future climate change scenarios using statistical downscaling to create anomalies from three General Circulation Models (CSIRO Mk3, MIROC 3.2 medres, and Hadley CM 3), each run through three CO2 emission scenarios (SRES B1, A1B, and A2).

Climate data for the western 2/3 of the states of Oregon and Washington from the PRISM group (Chris Daly, Oregon State University) at a 30arc second (800m) spatial grain.

The Geographic Information Retrieval and Analysis System (GIRAS) was developed in the mid 70s to put into digital form a number of data layers which were of interest to the USGS. One of these data layers was the Hydrologic Units. The map is based on the Hydrologic Unit Maps published by the U.S. Geological Survey Office of Water Data Coordination, together with the list descriptions and name of region, subregion, accounting units, and cataloging unit. The hydrologic units are encoded with an eight-digit number that indicates the hydrologic region (first two digits), hydrologic subregion second two digits), accounting unit (third two digits), and cataloging unit (fourth two digits). The data produced by GIRAS was...
For his MS thesis, Brendan Rogers used the vegetation model MC1 to simulate vegetation dynamics, associated carbon and nitrogen cycle, water budget and wild fire impacts across the western 2/3 of the states of Oregon and Washington using climate input data from the the PRISM group (Chris Daly, OSU) at a 30arc second (800m) spatial grain. The model was run from 1895 to 2100 assuming that nitrogen demand from the plants was always met so that the nitrogen concentrations in various plant parts never dropped below their minimum reported values. A CO2 enhancement effect increased productivity and water use efficiency as the atmospheric CO2 concentration increased. Future climate change scenarios were generated through...
For his MS thesis, Brendan Rogers used the vegetation model MC1 to simulate vegetation dynamics, associated carbon and nitrogen cycle, water budget and wild fire impacts across the western 2/3 of the states of Oregon and Washington using climate input data from the the PRISM group (Chris Daly, OSU) at a 30arc second (800m) spatial grain. The model was run from 1895 to 2100 assuming that nitrogen demand from the plants was always met so that the nitrogen concentrations in various plant parts never dropped below their minimum reported values. A CO2 enhancement effect increased productivity and water use efficiency as the atmospheric CO2 concentration increased. Future climate change scenarios were generated through...
Climate data for the western 2/3 of the states of Oregon and Washington from the PRISM group (Chris Daly, Oregon State University) at a 30arc second (800m) spatial grain.
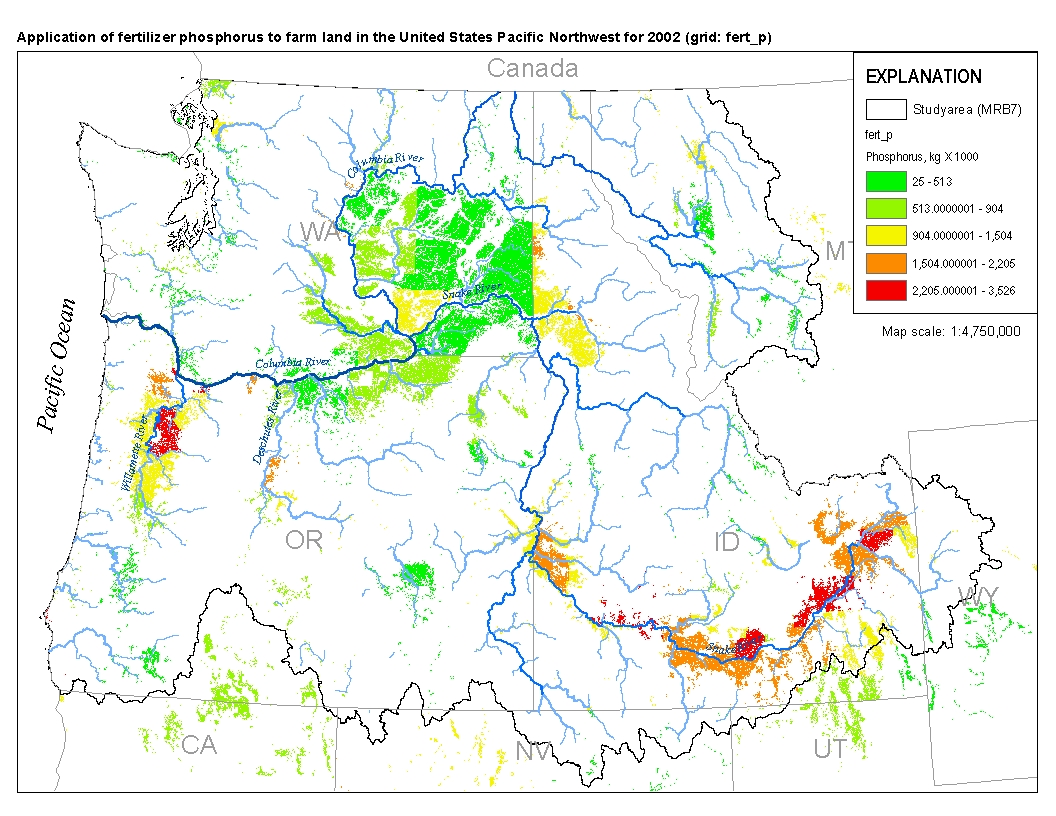
This spatial data set was created by the U.S. Geological Survey (USGS) to represent the amount of fertilizer phosphorus that was applied to farm land in the Pacific Northwest region of the United States (Hydro Region 17; Major River Basin 7 (MRB7)) during 2002.

These data were released prior to the October 1, 2016 effective date for the USGS’s policy dictating the review, approval, and release of scientific data as referenced in USGS Survey Manual Chapter 502.8 Fundamental Science Practices: Review and Approval of Scientific Data for Release. This spatial data set was created by the U.S. Geological Survey (USGS) to represent the amount of nitrogen and phosphorus generated by cattle at dairies and feedlots in the Pacific Northwest region of the United States (Hydro Region 17; Major River Basin 7 (MRB7)) during 2002 within each incremental watershed delineated in the NHDPlus v2 dataset.

These data were released prior to the October 1, 2016 effective date for the USGS’s policy dictating the review, approval, and release of scientific data as referenced in USGS Survey Manual Chapter 502.8 Fundamental Science Practices: Review and Approval of Scientific Data for Release. This spatial data set was created by the U.S. Geological Survey (USGS) to represent the area of land within each incremental watershed delineated in the NHDPlus v2 dataset in the Pacific Northwest region of the United States (Hydro Region 17; Major River Basin 7 (MRB7)) that potentially received waste from grazing cattle in 2002.

These data were released prior to the October 1, 2016 effective date for the USGS’s policy dictating the review, approval, and release of scientific data as referenced in USGS Survey Manual Chapter 502.8 Fundamental Science Practices: Review and Approval of Scientific Data for Release. This spatial data set was created by the U.S. Geological Survey (USGS) to represent the area of arid land irrigation in the Pacific Northwest region of the United States (Hydro Region 17; Major River Basin 7 (MRB7)) during 2001 within each incremental watershed delineated in the NHDPlus v2 dataset.
|

|
