Filters: Tags: PRECIPITATION (X)
1,186 results (72ms)|
Filters
Date Range
Extensions
Types Contacts
Categories Tag Types
|
These files include historical downscaled estimates of decadal average monthly snow-day fraction ("fs", units = percent probability from 1 – 100) for each month of the decades from 1900-1909 to 2000-2009 at 771 x 771 m spatial resolution. Each file represents a decadal average monthly mean. Version 1.0 was completed in 2015 Version 2.0 was completed in 2018 These snow-day fraction estimates were produced by applying equations relating decadal average monthly temperature to snow-day fraction to downscaled decadal average monthly temperature. Separate equations were used to model the relationship between decadal monthly average temperature and the fraction of wet days with snow for seven geographic regions in the...
Future climates are simulated by general circulation models (GCM) using climate change scenarios (IPCC 2014). To project climate change for the sagebrush biome, we used 11 GCMs and two climate change scenarios from the IPCC Fifth Assessment, representative concentration pathways (RCPs) 4.5 and 8.5 (Moss et al. 2010, Van Vuuren et al. 2011). RCP4.5 scenario represents a future where climate policies limit and achieve stabilization of greenhouse gas concentrations to 4.5 W m-2 by 2100. RCP8.5 scenario might be called a business-as-usual scenario, where high emissions of greenhouse gases continue in the absence of climate change policies. The two selected time frames allow comparison of near-term (2020-2050) and longer-term...
Categories: Data;
Types: Citation,
Downloadable,
GeoTIFF,
Map Service,
Raster;
Tags: Arizona,
CRS,
California,
Climate,
Colorado,
This data release contains tabular digital data describing calculated hourly back trajectory position coordinates for air masses contributing to five selected precipitation-mercury deposition episodes at National Atmospheric Deposition Program monitoring site IN21 (National Atmospheric Deposition Program, 2017) in southeastern Indiana during 2009‒2015. The air pollution transport and dispersion modeling system HYSPLIT (Stein et. al, 2015) was used to calculate the back trajectory position coordinates during 48 hours preceding the start of each episode. The 40-km gridded input data to HYSPLIT were from National Oceanic and Atmospheric Administration (2017). Continuous, digital precipitation depth data were recorded...
Categories: Data;
Tags: Indiana,
USGS Science Data Catalog (SDC),
air pollution,
atmospheric deposition,
dispersion model,

This dataset is a Basin Characterization Model (BCM) output using the PCM A2 Scenario for annual recharge, 2010-2039, clipped to the DRECP 12 km buffered boundary. Recharge: Amount of water exceeding field capacity that enters bedrock, occurs at a rate determined by the hydraulic conductivity of the underlying materials, excess water (rejected recharge) is added to runoff. The California Basin Characterization Model (BCM) climate dataset provides historical and projected climate surfaces for the state at a 270 meter resolution. The historical data is based on 4 kilometer PRISM data, and the projected climate surfaces are based on the A2 and B1 scenarios of the PCM and GFDL GCMs. The BCM approach uses a regional...
A beautiful plant found only on Haleakala may become rarer. A recent study coauthored by UH researcher Paul Krushelnycky shows changing climate patterns allowing fog and rain to reach higher elevations are threatening the plant but he cautions all is not lost. He joined us in our studio to tell us more. Paul is currently Assistant Researcher, at the College of Tropical Agriculture and Human Resources at the University of Hawaii in Manoa.
The national dataset was clipped to the WLCI envelope by USGS staff. No other processing was performed on the dataset. This map layer is commonly called Bailey's ecoregions and shows ecosystems of regional extent in the United States, Puerto Rico, and the U.S. Virgin Islands. Four levels of detail are included to show a hierarchy of ecosystems. The largest ecosystems are domains, which are groups of related climates and which are differentiated based on precipitation and temperature. Divisions represent the climates within domains and are differentiated based on precipitation levels and patterns as well as temperature. Divisions are subdivided into provinces, which are differentiated based on vegetation or other...
Categories: Data;
Types: Downloadable,
Map Service,
OGC WFS Layer,
OGC WMS Layer,
Shapefile;
Tags: acid rain,
animal/plant,
biotic,
ecosystem,
elevation,

The CRU temperature data were unmodified from the source. This particular map is an average for all months for the years 1961-1990.
This dataset is a Basin Characterization Model (BCM) output using the GFDL A2 Scenario for Climatic Water Deficit (CWD) in southern Sierra Nevada California, for 2010-2039. The term climatic water deficit defined by Stephenson (1998) is quantified as the amount of water by which potential evapotranspiration (PET) exceeds actual evapotranspiration (AET). This term effectively integrates the combined effects of solar radiation, evapotranspiration, and air temperature on watershed conditions given available soil moisture derived from precipitation. Climatic water deficit can be thought of as the amount of additional water that would have evaporated or transpired had it been present in the soils given the temperature...

This dataset is a Basin Characterization Model (BCM) output using the PCM A2 Scenario for annual Climatic Water Deficit (CWD), 2070-2099, clipped to the DRECP 12 km buffered boundary. The term climatic water deficit defined by Stephenson (1998) is quantified as the amount of water by which potential evapotranspiration (PET) exceeds actual evapotranspiration (AET). This term effectively integrates the combined effects of solar radiation, evapotranspiration, and air temperature on watershed conditions given available soil moisture derived from precipitation. Climatic water deficit can be thought of as the amount of additional water that would have evaporated or transpired had it been present in the soils given the...

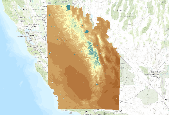
This dataset is a Basin Characterization Model (BCM) output using the PCM A2 Scenario for average Spring (March, April, May) snowpack, in central Sierra Nevada California, for 2040-2069. Snowpack: Amount of snow accumulated per month summed annually, or if divided by 12 average monthly snowpack. This is calculated as prior month's snowpack plus snowfall minus sublimation and snow melt. The California Basin Characterization Model (BCM) climate dataset provides historical and projected climate surfaces for the state at a 270 meter resolution. The historical data is based on 4 kilometer PRISM data, and the projected climate surfaces are based on the A2 and B1 scenarios of the PCM and GFDL GCMs. The BCM approach uses...

Using the simple anomaly method (modifying a historical baseline with differences or ratios projected by General Circulation Models), scientists from the California Academy of Sciences downscaled monthly average temperature and monthly total precipitation from 16 different global circulation models (GCMs). The GCMs were described in the latest Intergovernmental Panel for Climate Change (IPCC 2007) and archived at the WCRP PCMDI (http://www-pcmdi.llnl.gov/ipcc/about_ipcc.php). Monthly maximum temperature and monthly minimum temperatures were downscaled from the only 6 GCMs that archived these particular variables. Scientists used Worldclim v.1.4 (Hijmans et al 2005) at 5 arc-minute (~10km) spatial grain as the current...

Using the simple anomaly method (modifying a historical baseline with differences or ratios projected by General Circulation Models), scientists from the California Academy of Sciences downscaled monthly average temperature and monthly total precipitation from 16 different global circulation models (GCMs). The GCMs were described in the latest Intergovernmental Panel for Climate Change (IPCC 2007) and archived at the WCRP PCMDI (http://www-pcmdi.llnl.gov/ipcc/about_ipcc.php). Monthly maximum temperature and monthly minimum temperatures were downscaled from the only 6 GCMs that archived these particular variables. Scientists used Worldclim v.1.4 (Hijmans et al 2005) at 5 arc-minute (~10km) spatial grain as the current...

Using the simple anomaly method (modifying a historical baseline with differences or ratios projected by General Circulation Models), scientists from the California Academy of Sciences downscaled monthly average temperature and monthly total precipitation from 16 different global circulation models (GCMs). The GCMs were described in the latest Intergovernmental Panel for Climate Change (IPCC 2007) and archived at the WCRP PCMDI (http://www-pcmdi.llnl.gov/ipcc/about_ipcc.php). Monthly maximum temperature and monthly minimum temperatures were downscaled from the only 6 GCMs that archived these particular variables. Scientists used Worldclim v.1.4 (Hijmans et al 2005) at 5 arc-minute (~10km) spatial grain as the current...
|

|
