Filters: Tags: PROJECTIONS (X)
108 results (12ms)|
Filters
Date Range
Extensions Types Contacts
Categories Tag Types
|
Information on future land-use and land-cover (LULC) change is needed to analyze the impact of LULC change on ecological processes. The U.S. Geological Survey has produced spatially explicit, thematically detailed LULC projections for the conterminous United States. Four qualitative and quantitative scenarios of LULC change were developed, with characteristics consistent with the Intergovernmental Panel on Climate Change (IPCC) Special Report on Emission Scenarios (SRES). The four quantified scenarios (A1B, A2, B1, and B2) served as input to the forecasting scenarios of land-use change (FORE-SCE) model. Four spatially explicit data sets consistent with scenario storylines were produced for the conterminous United...
Categories: Publication;
Types: Journal Citation;
Tags: Conterminous United States,
Forest stand age,
Land use and Land cover,
Projections,
Spatially-explicit modeling

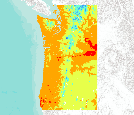
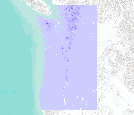
Soil residual water corresponds to the model variable "total streamflow." In the model MC1, this is calculated (in cm of water) as the water flowing through the soil profile below the last soil layer (streamflow), water leached into the subsoil (baseflow) and also includes runoff. The output is presented here as a monthly average. Soil residual water is part of the model output from Brendan Rogers' MS thesis work. Brendan used the vegetation model MC1 to simulate vegetation dynamics, associated carbon and nitrogen cycle, water budget and wild fire impacts across the western 2/3 of the states of Oregon and Washington using climate input data from the PRISM group (Chris Daly, OSU) at a 30arc second (800m) spatial...

Soil residual water corresponds to the model variable "total streamflow." In the model MC1, this is calculated (in cm of water) as the water flowing through the soil profile below the last soil layer (streamflow), water leached into the subsoil (baseflow) and also includes runoff. The output is presented here as a monthly average. Soil residual water is part of the model output from Brendan Rogers' MS thesis work. Brendan used the vegetation model MC1 to simulate vegetation dynamics, associated carbon and nitrogen cycle, water budget and wild fire impacts across the western 2/3 of the states of Oregon and Washington using climate input data from the PRISM group (Chris Daly, OSU) at a 30arc second (800m) spatial...

Soil residual water corresponds to the model variable "total streamflow." In the model MC1, this is calculated (in cm of water) as the water flowing through the soil profile below the last soil layer (streamflow), water leached into the subsoil (baseflow) and also includes runoff. The output is presented here as a monthly average. Soil residual water is part of the model output from Brendan Rogers' MS thesis work. Brendan used the vegetation model MC1 to simulate vegetation dynamics, associated carbon and nitrogen cycle, water budget and wild fire impacts across the western 2/3 of the states of Oregon and Washington using climate input data from the PRISM group (Chris Daly, OSU) at a 30arc second (800m) spatial...

Soil residual water corresponds to the model variable "total streamflow." In the model MC1, this is calculated (in cm of water) as the water flowing through the soil profile below the last soil layer (streamflow), water leached into the subsoil (baseflow) and also includes runoff. The output is presented here as a monthly average. Soil residual water is part of the model output from Brendan Rogers' MS thesis work. Brendan used the vegetation model MC1 to simulate vegetation dynamics, associated carbon and nitrogen cycle, water budget and wild fire impacts across the western 2/3 of the states of Oregon and Washington using climate input data from the PRISM group (Chris Daly, OSU) at a 30arc second (800m) spatial...

Soil residual water corresponds to the model variable "total streamflow." In the model Mc1, this is calculated (in cm of water) as the water flowing through the soil profile below the last soil layer (streamflow), Water leached in the subsoil (baseflow) and also includes runoff. the output is prsented here as a monthly average. Soil residual water is part of the model output from Brendan Rogers' MS thesis work. Brendan used the vegetation model MC1 to simulate vegetation dynamics, associated carbon and nitrogen cycle, water budget and wild fire impacts across the western 2/3 of the states of Oregon and Washington using climate input data from the PRISM group (Chris Daly, OSU) at a 30arc second (800m) spatial grain....
The article discusses a report published by the U.S. Dept. of Energy (DOE) that examined the technical feasibility of using wind energy for electricity generation. The report assessed the costs, impacts and challenges associated with the production of 20% wind energy by 2030. Results have shown that there is a need for an enhanced transmission infrastructure and an increase in turbine installations to achieve 20% wind energy.
For his MS thesis, Brendan Rogers used climate data from the PRISM group (Chris Daly, Oregon State University) at a 30arc second (800m) spatial grain across the western 2/3 of the states of Oregon and Washington to generate a climatology or baseline. He then created future climate change scenarios using statistical downscaling to create anomalies from three General Circulation Models (CSIRO Mk3, MIROC 3.2 medres, and Hadley CM 3), each run through three CO2 emission scenarios (SRES B1, A1B, and A2).

For his MS thesis, Brendan Rogers used climate data from the PRISM group (Chris Daly, Oregon State University) at a 30arc second (800m) spatial grain across the western 2/3 of the states of Oregon and Washington to generate a climatology or baseline. He then created future climate change scenarios using statistical downscaling to create anomalies from three General Circulation Models (CSIRO Mk3, MIROC 3.2 medres, and Hadley CM 3), each run through three CO2 emission scenarios (SRES B1, A1B, and A2).

For his MS thesis, Brendan Rogers used climate data from the PRISM group (Chris Daly, Oregon State University) at a 30arc second (800m) spatial grain across the western 2/3 of the states of Oregon and Washington to generate a climatology or baseline. He then created future climate change scenarios using statistical downscaling to create anomalies from three General Circulation Models (CSIRO Mk3, MIROC 3.2 medres, and Hadley CM 3), each run through three CO2 emission scenarios (SRES B1, A1B, and A2).
For his MS thesis, Brendan Rogers used the vegetation model MC1 to simulate vegetation dynamics, associated carbon and nitrogen cycle, water budget and wild fire impacts across the western 2/3 of the states of Oregon and Washington using climate input data from the PRISM group (Chris Daly, OSU) at a 30arc second (800m) spatial grain. The model was run from 1895 to 2100 assuming that nitrogen demand from the plants was always met so that the nitrogen concentrations in various plant parts never dropped below their minimum reported values. A CO2 enhancement effect increased productivity and water use efficiency as the atmospheric CO2 concentration increased. Future climate change scenarios were generated through statistical...
For his MS thesis, Brendan Rogers used the vegetation model MC1 to simulate vegetation dynamics, associated carbon and nitrogen cycle, water budget and wild fire impacts across the western 2/3 of the states of Oregon and Washington using climate input data from the PRISM group (Chris Daly, OSU) at a 30arc second (800m) spatial grain. The model was run from 1895 to 2100 assuming that nitrogen demand from the plants was always met so that the nitrogen concentrations in various plant parts never dropped below their minimum reported values. A CO2 enhancement effect increased productivity and water use efficiency as the atmospheric CO2 concentration increased. Future climate change scenarios were generated through statistical...
Categories: Project;
Tags: 2010,
Academics & scientific researchers,
Applications and Tools,
Conservation NGOs,
Data Acquisition and Development,
The article discusses a report published by the U.S. Dept. of Energy (DOE) that examined the technical feasibility of using wind energy for electricity generation. The report assessed the costs, impacts and challenges associated with the production of 20% wind energy by 2030. Results have shown that there is a need for an enhanced transmission infrastructure and an increase in turbine installations to achieve 20% wind energy.

For his MS thesis, Brendan Rogers used climate data from the PRISM group (Chris Daly, Oregon State University) at a 30arc second (800m) spatial grain across the western 2/3 of the states of Oregon and Washington to generate a climatology or baseline. He then created future climate change scenarios using statistical downscaling to create anomalies from three General Circulation Models (CSIRO Mk3, MIROC 3.2 medres, and Hadley CM 3), each run through three CO2 emission scenarios (SRES B1, A1B, and A2).
Soil residual water corresponds to the model variable "total streamflow"." In the model MC1, this is calculated (in cm of water) as the water flowing through the soil profile below the last soil layer (streamflow), water leached into the subsoil (baseflow) and also includes runoff. The output is presented here as a monthly average. Soil residual water is part of the model output from Brendan Rogers' MS thesis work. Brendan used the vegetation model MC1 to simulate vegetation dynamics, associated carbon and nitrogen cycle, water budget and wild fire impacts across the western 2/3 of the states of Oregon and Washington using climate input data from the PRISM group (Chris Daly, OSU) at a 30arc second (800m) spatial...

For his MS thesis, Brendan Rogers used the vegetation model MC1 to simulate vegetation dynamics, associated carbon and nitrogen cycle, water budget and wild fire impacts across the western 2/3 of the states of Oregon and Washington using climate input data from the PRISM group (Chris Daly, OSU) at a 30arc second (800m) spatial grain. The model was run from 1895 to 2100 assuming that nitrogen demand from the plants was always met so that the nitrogen concentrations in various plant parts never dropped below their minimum reported values. A CO2 enhancement effect increased productivity and water use efficiency as the atmospheric CO2 concentration increased. Future climate change scenarios were generated through statistical...
For his MS thesis, Brendan Rogers used climate data from the PRISM group (Chris Daly, Oregon State University) at a 30arc second (800m) spatial grain across the western 2/3 of the states of Oregon and Washington to generate a climatology or baseline. He then created future climate change scenarios using statistical downscaling to create anomalies from three General Circulation Models (CSIRO Mk3, MIROC 3.2 medres, and Hadley CM 3), each run through three CO2 emission scenarios (SRES B1, A1B, and A2).
OPTIONS model- post processing- of structural stages, stand age, and Northern Spotted Owl (NSO) habitat index at years 0, 10, 20, 30, 40, 50, 100 for the Coos Bay Sustained Yield Unit (SYU) portion of the Western Oregon Plan Revision (WOPR) area. *See Appendix R of the Western Oregon Plan Revision Proposed Resource Management Plan for further description.BLM (Bureau of Land Management) WOPR (Western Oregon Plan Revision) WOPR Theme Group: OPT (Options) WOPR Purpose: O (Options) GLUA: General Land Use Allocations PRMP: Proposed Resource Management Plan ASQ (Allowable Sale Quantity) SYU (Sustained Yield Unit) ESC (Existing Stand Condition) M4C WPR_ID (a unique identifier generated in the options harvest model preparation...

Soil residual water corresponds to the model variable "total streamflow." In the model MC1, this is calculated (in cm of water) as the water flowing through the soil profile below the last soil layer (streamflow), water leached into the subsoil (baseflow) and also includes runoff. The output is presented here as a monthly average. Soil residual water is part of the model output from Brendan Rogers' MS thesis work. Brendan used the vegetation model MC1 to simulate vegetation dynamics, associated carbon and nitrogen cycle, water budget and wild fire impacts across the western 2/3 of the states of Oregon and Washington using climate input data from the PRISM group (Chris Daly, OSU) at a 30arc second (800m) spatial...
|

|
