Filters: Tags: Pacific (X)
392 results (30ms)|
Filters
Date Range
Extensions Types Contacts
Categories
Tag Types
|
This data set contains imagery from the National Agriculture Imagery Program (NAIP). The NAIP program is administered by USDA FSA and has been established to support two main FSA strategic goals centered on agricultural production. These are, increase stewardship of America's natural resources while enhancing the environment, and to ensure commodities are procured and distributed effectively and efficiently to increase food security. The NAIP program supports these goals by acquiring and providing ortho imagery that has been collected during the agricultural growing season in the U.S. The NAIP ortho imagery is tailored to meet FSA requirements and is a fundamental tool used to support FSA farm and conservation programs....
This data set contains imagery from the National Agriculture Imagery Program (NAIP). The NAIP program is administered by USDA FSA and has been established to support two main FSA strategic goals centered on agricultural production. These are, increase stewardship of America's natural resources while enhancing the environment, and to ensure commodities are procured and distributed effectively and efficiently to increase food security. The NAIP program supports these goals by acquiring and providing ortho imagery that has been collected during the agricultural growing season in the U.S. The NAIP ortho imagery is tailored to meet FSA requirements and is a fundamental tool used to support FSA farm and conservation programs....
This data set contains imagery from the National Agriculture Imagery Program (NAIP). The NAIP program is administered by USDA FSA and has been established to support two main FSA strategic goals centered on agricultural production. These are, increase stewardship of America's natural resources while enhancing the environment, and to ensure commodities are procured and distributed effectively and efficiently to increase food security. The NAIP program supports these goals by acquiring and providing ortho imagery that has been collected during the agricultural growing season in the U.S. The NAIP ortho imagery is tailored to meet FSA requirements and is a fundamental tool used to support FSA farm and conservation programs....
For more than 25 years, the U.S. Geological Survey Gas Hydrates Project has compiled and maintained an internal database of locations where the existence of gas hydrate has been confirmed or inferred in research studies. The existence of gas hydrate was considered confirmed when gas hydrate was recovered by researchers or videotaped from a vehicle (such as a submersible or remotely operated vehicle) near the sea floor. The existence of gas hydrate was considered inferred when seismic data, borehole logs, or certain geochemical characteristics match anomalies known to characterize gas hydrate. This data release provides a text description of the region, geographic coordinates, and the citation for the published reference...
Layered geospatial PDF Map. Layers of geospatial data include orthoimagery, roads, grids, geographic names, elevation contours, hydrography, and other selected map features.
Layered GeoPDF 7.5 Minute Quadrangle Map. Layers of geospatial data include orthoimagery, roads, grids, geographic names, elevation contours, hydrography, and other selected map features.
Layered GeoPDF 7.5 Minute Quadrangle Map. Layers of geospatial data include orthoimagery, roads, grids, geographic names, elevation contours, hydrography, and other selected map features.
Layered GeoPDF 7.5 Minute Quadrangle Map. Layers of geospatial data include orthoimagery, roads, grids, geographic names, elevation contours, hydrography, and other selected map features.
USGS Historical Quadrangle in GeoPDF.
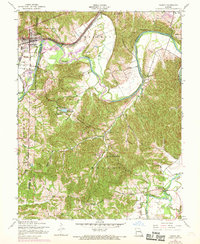
USGS Historical Quadrangle in GeoPDF.
This dataset is a running trend analysis of baseflow from USGS stream gage records from as early as 1911 to 2016 for 23 unregulated streams across the five largest Hawaiian Islands: Kauai, Oʻahu, Molokaʻi, Maui, and Hawaiʻi. First, we separated mean daily flow into direct run‐off and baseflow with the “lfstat” separation procedure in R, which employs the Institute of Hydrology (1980) standard baseflow separation procedure of 5‐day blocks to identify minimum flow, called a turning point. The turning points are then connected to obtain the baseflow hydrograph. For each stream, Sen's slope and Mann–Kendall statistic were calculated incrementally using the R package “trend” to give window sizes from 10‐107 years depending...
In February 2016 the University of Washington in cooperation with the U.S. Geological Survey, Pacific Coastal and Marine Science Center (USGS, PCMSC) collected multibeam bathymetry and acoustic-backscatter data in and near the Catalina Basin, southern California aboard the University of Washington's Research Vessel Thomas G. Thompson. Data was collected using a Kongsberg EM300 multibeam echosounder hull-mounted to the 274-foot R/V Thomas G. Thompson. The USGS, PCMSC processed these data and produced a series of bathymetric surfaces and acoustic-backscatter images for scientific research purposes. This data release provides a 10-m resolution bathymetry surface and a 10-m resolution acoustic backscatter image. In...
Categories: Data;
Types: Citation;
Tags: Bathymetry,
Bathymetry,
Bathymetry and Elevation,
CMGP,
Catalina Basin,
Alamagan Volcano is a Quaternary stratovolcano along the Mariana Arc, an active subduction zone in the western Pacific Ocean. Although primarily submerged, its peak reaches above sea level, with subaerially-exposed volcanic deposits dating back through the Holocene to the late Pleistocene. These feature data represent such deposits and other geologic features of Alamagan Volcano, describing its interpreted eruptive history.
Categories: Data;
Types: Downloadable,
Map Service,
OGC WFS Layer,
OGC WMS Layer,
Shapefile;
Tags: Alamagan Island,
Andesite,
CartographicLines,
Intermediate volcanic rock,
Lava flow,
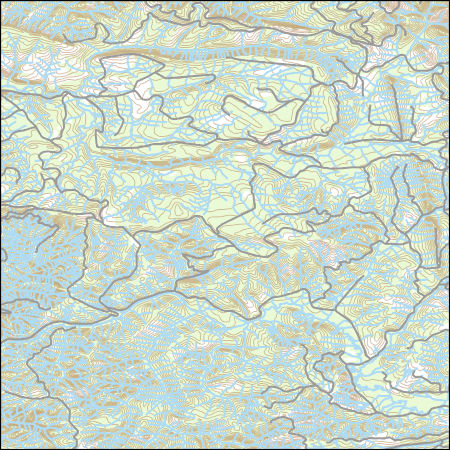
Layers of geospatial data include contours, boundaries, land cover, hydrography, roads, transportation, geographic names, structures, and other selected map features.
Types: Citation;
Tags: 7.5 x 7.5 minute,
7_5_Min,
Combined Vector,
Combined Vector,
Combined Vector,
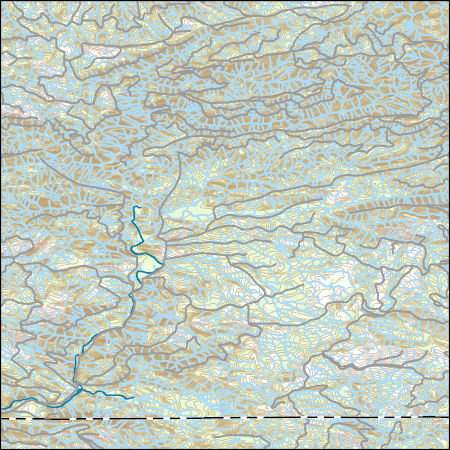
Layers of geospatial data include contours, boundaries, land cover, hydrography, roads, transportation, geographic names, structures, and other selected map features.
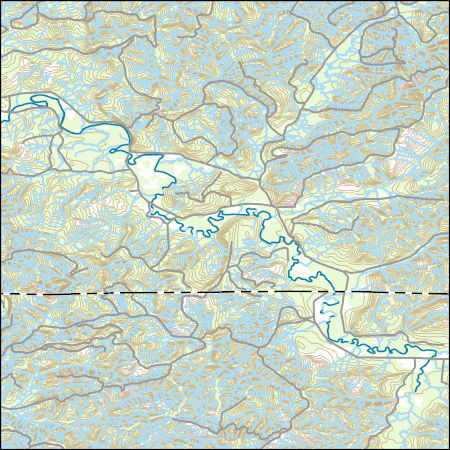
Layers of geospatial data include contours, boundaries, land cover, hydrography, roads, transportation, geographic names, structures, and other selected map features.
Layers of geospatial data include contours, boundaries, land cover, hydrography, roads, transportation, geographic names, structures, and other selected map features.
Types: Citation;
Tags: 7.5 x 7.5 minute,
7_5_Min,
Combined Vector,
Combined Vector,
Combined Vector,
|

|
