Filters: Tags: Pacific Northwest (X)
570 results (16ms)|
Filters
Date Range
Extensions
Types
Contacts
Categories Tag Types
|

A warming climate could profoundly affect the distribution and abundance of many fishes. Bull trout (Salvelinus confluentus) may be especially vulnerable to climate change given that spawning and early rearing are constrained by cold water temperatures creating a patchwork of natal headwater habitats across river networks. Because the size and connectivity of patches also appear to influence the persistence of local populations, climate warming could lead to increasing fragmentation of remaining habitats and accelerated decline of this species. We modeled the relationships between (1) the lower elevation limits of small bull trout and mean annual air temperature and (2) latitude and longitude across the species...

Models of Monitoring Avian Productivity and Survival (MAPS) demographic data and high-resolution land cover data The top selected model of productivity indices suggested that productivity indices increased with distance from streams, where local coniferous forest cover (2km context) increased from 10 and 25% (mean `17%), within total forest cover of ~20% in a 2km context (N = 84, R2 = 0.26, P<0.0001). MacGillivray's Warbler station lifetime productivity (STAPI) (log transformed) ranged between +0.090 and +0.564 with a mean value of +0.327 and a median value of +0.325. ________________________________________ Model 1 (3 parameters) MacGillivray's Warbler station lifetime productivity (STAPI) (log transformed)...

Soil residual water corresponds to the model variable "total streamflow." In the model MC1, this is calculated (in cm of water) as the water flowing through the soil profile below the last soil layer (streamflow), water leached into the subsoil (baseflow) and also includes runoff. The output is presented here as a monthly average. Soil residual water is part of the model output from Brendan Rogers' MS thesis work. Brendan used the vegetation model MC1 to simulate vegetation dynamics, associated carbon and nitrogen cycle, water budget and wildfire impacts across the western 2/3 of the states of Oregon and Washington using climate input data from the PRISM group (Chris Daly, OSU) at a 30arc second (800m) spatial grain....

Soil residual water corresponds to the model variable "total streamflow." In the model MC1, this is calculated (in cm of water) as the water flowing through the soil profile below the last soil layer (streamflow), water leached into the subsoil (baseflow) and also includes runoff. The output is presented here as a monthly average. Soil residual water is part of the model output from Brendan Rogers' MS thesis work. Brendan used the vegetation model MC1 to simulate vegetation dynamics, associated carbon and nitrogen cycle, water budget and wildfire impacts across the western 2/3 of the states of Oregon and Washington using climate input data from the PRISM group (Chris Daly, OSU) at a 30arc second (800m) spatial grain....

Soil residual water corresponds to the model variable "total streamflow." In the model MC1, this is calculated (in cm of water) as the water flowing through the soil profile below the last soil layer (streamflow), water leached into the subsoil (baseflow) and also includes runoff. The output is presented here as a monthly average. Soil residual water is part of the model output from Brendan Rogers' MS thesis work. Brendan used the vegetation model MC1 to simulate vegetation dynamics, associated carbon and nitrogen cycle, water budget and wild fire impacts across the western 2/3 of the states of Oregon and Washington using climate input data from the PRISM group (Chris Daly, OSU) at a 30arc second (800m) spatial...

Soil residual water corresponds to the model variable "total streamflow." In the model MC1, this is calculated (in cm of water) as the water flowing through the soil profile below the last soil layer (streamflow), water leached into the subsoil (baseflow) and also includes runoff. The output is presented here as a monthly average. Soil residual water is part of the model output from Brendan Rogers' MS thesis work. Brendan used the vegetation model MC1 to simulate vegetation dynamics, associated carbon and nitrogen cycle, water budget and wild fire impacts across the western 2/3 of the states of Oregon and Washington using climate input data from the PRISM group (Chris Daly, OSU) at a 30arc second (800m) spatial...

A warming climate could profoundly affect the distribution and abundance of many fishes. Bull trout (Salvelinus confluentus) may be especially vulnerable to climate change given that spawning and early rearing are constrained by cold water temperatures creating a patchwork of natal headwater habitats across river networks. Because the size and connectivity of patches also appear to influence the persistence of local populations, climate warming could lead to increasing fragmentation of remaining habitats and accelerated decline of this species. We modeled the relationships between (1) the lower elevation limits of small bull trout and mean annual air temperature and (2) latitude and longitude across the species...
Tsunamis have the potential to cause considerable damage to communities along the U.S. Pacific Northwest coastline. As coastal communities expand over time, the potential societal impact of tsunami inundation changes. To understand how community exposure to tsunami hazards may change in coming decades, we projected future development (i.e. urban, residential, and rural), households, and residents over a 50-year period (2011-2061) along the Washington, Oregon, and northern California coasts. We created a spatially explicit, land use/land cover, state-and-transition simulation model to project future developed land use based on historical development trends. We then compared our development projection results to tsunami-hazard...
Categories: Data;
Types: Citation;
Tags: Hazards,
Land Use Change,
Pacific Northwest,
Tsunamis,
USGS Science Data Catalog (SDC)
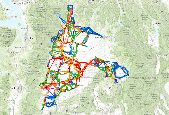
For a description of each map layer, select the Details tab, then select a Layer Name.This GIS dataset is part of a suite of wildlife habitat connectivity data produced by the Washington Wildlife Habitat Connectivity Working Group (WHCWG). The WHCWG is a voluntary public-private partnership between state and federal agencies, universities, tribes, and non-governmental organizations. The WHCWG is co-led by the Washington Department of Fish and Wildlife (WDFW) and the Washington Department of Transportation (WSDOT). This dataset quantifies current wildlife habitat connectivity patterns for the Columbia Plateau Ecoregion in Washington, Oregon, and Idaho. Available WHCWG raster data include model base layers, resistance,...

For his MS thesis, Brendan Rogers used the vegetation model MC1 to simulate vegetation dynamics, associated carbon and nitrogen cycle, water budget and wild fire impacts across the western 2/3 of the states of Oregon and Washington using climate input data from the PRISM group (Chris Daly, OSU) at a 30arc second (800m) spatial grain. The model was run from 1895 to 2100 assuming that nitrogen demand from the plants was always met so that the nitrogen concentrations in various plant parts never dropped below their minimum reported values. A CO2 enhancement effect increased productivity and water use efficiency as the atmospheric CO2 concentration increased. Future climate change scenarios were generated through statistical...
Three components of the scientific research included a literature review, a geospatial database, and ethnographic research. The literature review surveyed the professional, grey, and peer-reviewed literature on spatial conflicts in the marine environment. Summaries of the literature tracked how stakeholders resolved, mitigated, and addressed space use conflicts. A geospatial database was developed to include available GIS data and new GIS data produced by the study team. The ethnographic data collection occured by engaging individuals and small groups in one on one guided discussions. In addition, the study team convened larger group meetings to describe the study and to develop contacts for further research.

For a description of each map layer, select the Details tab, then select a Layer Name. This GIS dataset is part of a suite of wildlife habitat connectivity data produced by the Washington Wildlife Habitat Connectivity Working Group (WHCWG). The WHCWG is a voluntary public-private partnership between state and federal agencies, universities, tribes, and non-governmental organizations. The WHCWG is co-led by the Washington Department of Fish and Wildlife (WDFW) and the Washington Department of Transportation (WSDOT). This dataset quantifies current wildlife habitat connectivity patterns for the Columbia Plateau Ecoregion in Washington, Oregon, and Idaho. Available WHCWG raster data include model base layers, resistance,...

For his MS thesis, Brendan Rogers used climate data from the PRISM group (Chris Daly, Oregon State University) at a 30arc second (800m) spatial grain across the western 2/3 of the states of Oregon and Washington (USA) to generate a climatology or baseline. He then created future climate change scenarios using statistical downscaling to create anomalies from three General Circulation Models (CSIRO Mk3, MIROC 3.2 medres, and Hadley CM 3), each run through three CO2 emission scenarios (SRES B1, A1B, and A2).

The dataset contains 3 maps that show the current and predicted range of Mountain hemlock (Tsuga mertensiana) in the Pacific Northwest region. The layers include: 1) the species range modeled under current climate conditions for 1950-75 2) a continuous model of the predicted range for 1950-2006 and 3) potential range expansion and contraction from 2000-2009.
This dataset contains information from visual encounter surveys conducted between 2012 and 2016 by USGS as part of an ongoing Oregon spotted frog (Rana pretiosa) monitoring effort in the Oregon Cascade Mountain Range. We surveyed 91 sites using a rotating frame design in the Klamath and Deschutes Basins, Oregon, which encompass most of the species' core extant range. Data consist of spotted frog counts aggregated by date, location, and life stage, as well as data on environmental conditions at the time of each survey.
This dataset contains information from surveys conducted 2004-2015 by USGS as part of a long-term amphibian monitoring effort in the Willamette Valley, Oregon. Data consist of site, survey, habitat, and species detection covariates.
These data provide the locations and phenological dates of three shrub species: beaked hazelnut (Corylus cornuta), Oregon grape (Mahonia aquifolium), and salal (Gaultheria shallon), collected from various publicly available data sources including data from USFS Forest Inventory and Analysis program, USFS R-6 Ecology Program, US National Park Service, USDI Bureau of Land Management, USA National Phenology Network, the Consortium of PNW Herbaria, the Wilbur L. Bluhm Plant Phenology Study, GBIF, and iNaturalist, as well phenology data collected from the Olympia Forestry Sciences Laboratory in Olympia, Washington.
Categories: Data;
Tags: California,
Oregon,
Pacific Northwest,
USGS Science Data Catalog (SDC),
Washington,
The Sea Surface Temperature (SST) data of the nearshore region of the North Pacific show temperature ranges in degrees C using points whose locations correspond to the centroids of AVHRR Pathfinder version 5 monthly, global, 4 km data set (PFSST V50). The pathfinder rasters are available from the Physical Oceanography Distributed Active Archive Center (PO.DAAC), hosted by NASA JPL. The data points in this dataset lie within a 20 km buffer from the GSHHS (Global Self-consistent, Hierarchical, High-resolution Shoreline) coastline. The GSHHS vector data are available from the National Geophysical Data Center (NGDC). Furthermore, each point in the SST dataset is categorized by the ecoregion in which it is located. This...
This GIS dataset is the primary data product produced for the NW Climate Science Center-funded project, "Rangewide climate vulnerability assessment for threatened Bull Trout" (FRESC Study ID 851). We used predictions of temperatures in streams across approximately two-thirds of the species' range in the U.S. to map coldwater streams or “patches” suitable for spawning and early rearing of Bull Trout. Each patch consists of streams with contiguous reaches of cold water. Patches were delineated using medium resolution National Hydrography Dataset streams containing modeled temperatures available at 1 km intervals, as provided by the NorWeST project (http://www.fs.fed.us/rm/boise/AWAE/projects/NorWeST.html).Once the...
Categories: Data;
Types: Downloadable,
Map Service,
OGC WFS Layer,
OGC WMS Layer,
Shapefile;
Tags: Bull trout,
Clark Fork River,
Clearwater River,
Climate change,
Columbia River,
The research was conducted at nine tidal marshes in coastal estuaries spanning the Washington and Oregon coastlines from Padilla Bay in northern Washington to Bandon located at the mouth of the Coquille River in southern Oregon. We performed bathymetric surveys using a shallow-water echo-sounding system comprised of an acoustic profiler, Leica Viva RTK GPS, and laptop computer mounted on a shallow-draft, portable flat-bottom boat. The RTK GPS enabled high resolution elevations of the water surface. The rover positions were received from the Leica Smartnet system (www.lecia-geosystems.com) or base station and referenced to the same bench mark used in the elevation surveys. We mounted a variable frequency transducer...
Categories: Data;
Types: ArcGIS REST Map Service,
ArcGIS Service Definition,
Downloadable,
Map Service;
Tags: Bandon,
Bandon marsh,
Bull Island,
Coos Bay,
Grays Harbor,
|

|
